import pandas as pd
import numpy as np
import matplotlib.pyplot as plt
import matplotlib.ticker as ticker
import seaborn as sns
import datetime9 COVID-19 Reports
9.0.1 Introduction
Use the SyntheaMass data and rerun the code from this website to practice analyzing healthcare data using Python. I modified some code blocks to handle analysis involving several related tables in the healthcare database.
In this post, we will learn how to:
Define specific groups of patients, such as those who contracted COVID-19, were hospitalized, admitted to the ICU, placed on ventilators, and more
Calculate age, age at death, time points of COVID-19 events, symptom timelines, and hospital stay lengths
Aggregate metrics such as counts, means, and sums of symptoms and COVID-19 outcomes
Explore lab values Plot key metrics
Use Python functions to simplify code blocks in the report by calling external .py files such as analysis.py
9.0.2 Loading necessary python packages and Data
# Ensure all columns are shown
pd.set_option('display.max_columns', None)
pd.set_option('display.width', None)
Load the SyntheaMass data from the CSV files.
# Load the data
conditions = pd.read_csv("/Users/nnthieu/SyntheaData/SyntheaCovid19/conditions.csv")
patients = pd.read_csv("/Users/nnthieu/SyntheaData/SyntheaCovid19/patients.csv")
observations = pd.read_csv("/Users/nnthieu/SyntheaData/SyntheaCovid19/observations.csv")
care_plans = pd.read_csv("/Users/nnthieu/SyntheaData/SyntheaCovid19/careplans.csv")
encounters = pd.read_csv("/Users/nnthieu/SyntheaData/SyntheaCovid19/encounters.csv")
devices = pd.read_csv("/Users/nnthieu/SyntheaData/SyntheaCovid19/devices.csv")
supplies = pd.read_csv('/Users/nnthieu/SyntheaData/SyntheaCovid19/supplies.csv')
procedures = pd.read_csv("/Users/nnthieu/SyntheaData/SyntheaCovid19/procedures.csv")
medications = pd.read_csv("/Users/nnthieu/SyntheaData/SyntheaCovid19/medications.csv")
9.0.3 Define COVID-19 Patients
covid_patient_ids = conditions[conditions.CODE == 840539006].PATIENT.unique()
inpatient_ids = encounters[(encounters.REASONCODE == 840539006) & (encounters.CODE == 1505002)].PATIENT.unique()
isolation_ids = care_plans[(care_plans.CODE == 736376001) & (care_plans.REASONCODE == 840539006)].PATIENT.unique()
icu_patient_ids = encounters[(encounters.REASONCODE == 840539006) & (encounters.CODE == 305351004)].PATIENT.unique()
vent_ids = procedures[procedures.CODE == 26763009].PATIENT.unique()
deceased_ids = patients[patients.DEATHDATE.notna()].Id.unique()
negative_covid_patient_ids = observations[(observations.CODE == '94531-1') &
                                    (observations.VALUE == 'Not detected (qualifier value)')].PATIENT.unique()
completed_isolation_patients = care_plans[(care_plans.CODE == 736376001) & (care_plans.STOP.notna()) &
                                          (care_plans.REASONCODE == 840539006)].PATIENT.unique()
survivor_ids = np.union1d(completed_isolation_patients, negative_covid_patient_ids)

# Filter patients who have COVID-19
covid_patients = patients[patients.Id.isin(covid_patient_ids)]  # Correct column name to 'Id'
len(covid_patient_ids)88166The number of inpatient survivors
np.intersect1d(inpatient_ids, survivor_ids).shape(14654,)The number of inpatient non-survivors
np.intersect1d(inpatient_ids, deceased_ids).shape[0]3548Mortality rate of covid-19 patients
round((np.intersect1d(covid_patient_ids, deceased_ids).shape[0]/len(covid_patient_ids))* 100, 2)4.13Prepare a DataFrame with the number of patients in each category
# 1. Find the earliest COVID-19 start date
covid_start_date = pd.to_datetime(conditions[conditions['DESCRIPTION'] == 'COVID-19']['START'].min())

# 2. Set the maximum allowed COVID-19 date (80 days later)
covid_max_date = covid_start_date + pd.Timedelta(days=80)

# Ensure the 'START' column is in datetime format
conditions['START'] = pd.to_datetime(conditions['START'], errors='coerce')
observations['DATE'] = pd.to_datetime(observations['DATE'], errors='coerce')

# 3. Create a boolean mask for rows within the COVID-19 date range and for COVID-19 diagnosis
covid_date_mask = (conditions['START'] >= covid_start_date) & (conditions['START'] <= covid_max_date)

# 4. Filter `conditions` and `observations` based on the date range
covid_cons = conditions[covid_date_mask]
covid_obs = observations[
    (observations['DATE'] >= covid_start_date) & (observations['DATE'] <= covid_max_date)
]

# 5. Display first few rows
print(covid_cons.head(3))
covid_cons.shape
START STOP PATIENT \
2 2020-03-01 2020-03-30 1ff7f10f-a204-4bb1-aa72-dd763fa99482
3 2020-03-01 2020-03-01 1ff7f10f-a204-4bb1-aa72-dd763fa99482
4 2020-03-01 2020-03-30 1ff7f10f-a204-4bb1-aa72-dd763fa99482
ENCOUNTER CODE DESCRIPTION
2 60584c6a-e26b-4176-a660-86ad84c7ceca 386661006 Fever (finding)
3 60584c6a-e26b-4176-a660-86ad84c7ceca 840544004 Suspected COVID-19
4 60584c6a-e26b-4176-a660-86ad84c7ceca 840539006 COVID-19 (654569, 6)9.0.4 Health outcomes experienced by COVID-19 patients
The following table shows different health outcomes that were experienced by COVID-19 patients during the course of the disease.
File analysis.py is written and saved in a local working folder.
write a function in analysis.py like import analysis analysis.outcome_table(inpatient_ids, survivor_ids, deceased_patients, covid_cons) to create a table as: outcome total percent of inpatient survivors percent survivors non survivors percent non survivors with outcome are values of covid_condition.DESCRIPTION containing (disorder)
def outcome_table(inpatient_ids, survivor_ids, deceased_ids, covid_cons):
    # Filter conditions containing "(disorder)" in the DESCRIPTION
    disorder_conditions = covid_cons[
        (covid_cons['DESCRIPTION'].str.contains(r'\(disorder\)', na=False)) &
        (~covid_cons['DESCRIPTION'].str.contains(
            r'pneumonia|hypoxemia|chronic|Hypertriglyceridemia|Hyperlipidemia|Hypercholesterolemia|Metabolic|osteoporosis|Alzheimer|Anemia|sinusitis|thrombosis|embolism|pharyngitis|bronchitis', case=False, na=False))
        ]

    # Initialize the result table
    table_rows = []

    for outcome in disorder_conditions['DESCRIPTION'].unique():
        # Filter patients with the specific outcome
        outcome_patients = disorder_conditions[disorder_conditions['DESCRIPTION']
                                               == outcome]['PATIENT'].unique()

        # Calculate metrics
        total = len(outcome_patients)
        inpatient = len(set(outcome_patients) & set(inpatient_ids))
        survivors = len(set(outcome_patients) & set(survivor_ids))
        non_survivors = len(set(outcome_patients) & set(deceased_ids))

        percent_inpatient = (inpatient / len(inpatient_ids)) * \
            100 if len(inpatient_ids) > 0 else 0
        percent_survivors = (survivors / len(survivor_ids)) * \
            100 if len(survivor_ids) > 0 else 0
        percent_non_survivors = (
            non_survivors / len(deceased_ids)) * 100 if len(deceased_ids) > 0 else 0

        # Append row to the table
        table_rows.append({
            'outcome': outcome,
            'total': total,
            'percent of inpatient': round(percent_inpatient, 2),
            'survivors': survivors,
            'percent survivors': round(percent_survivors, 2),
            'non survivors': non_survivors,
            'percent non survivors': round(percent_non_survivors, 2)
        })

    # Convert to DataFrame
    outcome_table = pd.DataFrame(table_rows).head(7)
    outcome_table = outcome_table.sort_values(by='total', ascending=False)
    outcome_table['outcome'] = outcome_table['outcome'].str.replace(
    r'\(disorder\)', '', regex=True).str.strip()

    return outcome_table

outcome_table(inpatient_ids, survivor_ids, deceased_ids, covid_cons)| outcome | total | percent of inpatient | survivors | percent survivors | non survivors | percent non survivors | |
|---|---|---|---|---|---|---|---|
| 1 | Acute respiratory failure | 8701 | 47.87 | 5237 | 5.99 | 3473 | 14.38 |
| 0 | Sepsis caused by virus | 6941 | 38.19 | 3419 | 3.91 | 3526 | 14.60 |
| 6 | Acute respiratory distress syndrome | 2400 | 13.20 | 85 | 0.10 | 2315 | 9.59 |
| 2 | Septic shock | 1746 | 9.61 | 0 | 0.00 | 1746 | 7.23 |
| 5 | Heart failure | 1431 | 7.87 | 122 | 0.14 | 1309 | 5.42 |
| 4 | Injury of heart | 1288 | 7.09 | 20 | 0.02 | 1268 | 5.25 |
| 3 | Injury of kidney | 1252 | 6.89 | 8 | 0.01 | 1244 | 5.15 |
9.0.5 Outcomes for all COVID-19 Patients
This code builds a new DataFrame for the purposes of display. The DataFrame contains the percentages of patients that experience a particular outcome. Percentages are then provided for only hospitalized patients, ICU admitted patients and ventilated patients.
covid_conditions = conditions[conditions.CODE == 840539006]

cp = covid_conditions.merge(patients, how='left', left_on='PATIENT', right_on='Id')
isolation_ids = care_plans[(care_plans.CODE == 736376001) & (care_plans.REASONCODE == 840539006)].PATIENT
cp['isolation'] = cp.Id.isin(isolation_ids)
cp['admit'] = cp.Id.isin(inpatient_ids)
cp['recovered'] = cp.Id.isin(survivor_ids)
cp['death'] = cp.DEATHDATE.notna()
icu_ids = encounters[encounters.CODE == 305351004].PATIENT
cp['icu_admit'] = cp.Id.isin(icu_ids)
vent_ids = procedures[procedures.CODE == 26763009].PATIENT
cp['ventilated'] = cp.Id.isin(vent_ids)
# Recode the boolean columns from True/False to text to read easily
hospitalized = (cp.admit == True)
icu = (cp.icu_admit == True)
vent = (cp.ventilated == True)
covid_count = cp.Id.size
row_filters = {'Home Isolation': (cp.isolation == True),
'Hospital Admission': hospitalized,
'ICU Admission': icu,
'Ventilated': vent,
'Recovered': (cp.recovered == True),
'Death': (cp.death == True)}
table_rows = []
for category, row_filter in row_filters.items():
row = {'Outcome': category}
row['All Patients'] = round(cp[row_filter].Id.size / covid_count, 2)
row['Hospitalized'] = round(cp[row_filter & hospitalized].Id.size / hospitalized.value_counts()[True], 2)
row['ICU Admitted'] = round(cp[row_filter & icu].Id.size / icu.value_counts()[True], 2)
row['Ventilated'] = round(cp[row_filter & vent].Id.size / vent.value_counts()[True], 2)
table_rows.append(row)
pd.DataFrame.from_records(table_rows)| Outcome | All Patients | Hospitalized | ICU Admitted | Ventilated | |
|---|---|---|---|---|---|
| 0 | Home Isolation | 0.80 | 0.03 | 0.03 | 0.03 |
| 1 | Hospital Admission | 0.21 | 1.00 | 1.00 | 1.00 |
| 2 | ICU Admission | 0.04 | 0.20 | 1.00 | 1.00 |
| 3 | Ventilated | 0.03 | 0.16 | 0.79 | 1.00 |
| 4 | Recovered | 0.96 | 0.81 | 0.32 | 0.15 |
| 5 | Death | 0.04 | 0.20 | 0.68 | 0.85 |
9.0.6 Outcomes for ICU Admitted Patients
Essentially a sub table from above, looking only at ICU patients.
icu_only = cp[cp.icu_admit == True]
vent = (icu_only.ventilated == True)
covid_count = icu_only.Id.size
row_filters = {'Ventilated': vent,
               'Recovered': (icu_only.recovered == True),
               'Death': (icu_only.death == True)}

table_rows = []
for category, row_filter in row_filters.items():
    row = {'Outcome': category}
    row['ICU Admitted'] = round(icu_only[row_filter].Id.size / covid_count, 2)
    row['Ventilated'] = round(icu_only[row_filter & vent].Id.size / vent.value_counts()[True], 2)

    table_rows.append(row)

pd.DataFrame.from_records(table_rows)| Outcome | ICU Admitted | Ventilated | |
|---|---|---|---|
| 0 | Ventilated | 0.79 | 1.00 |
| 1 | Recovered | 0.32 | 0.15 |
| 2 | Death | 0.68 | 0.85 |
Start to build a DataFrame that we can use to look at other conditions in relation to COVID-19
covid_info = cp[['PATIENT', 'recovered', 'death', 'START', 'DEATHDATE', 'BIRTHDATE', 'GENDER', 'admit', 'icu_admit']]
covid_info = covid_info.rename(columns={'START': 'covid_start'})
covid_info.head(2)| PATIENT | recovered | death | covid_start | DEATHDATE | BIRTHDATE | GENDER | admit | icu_admit | |
|---|---|---|---|---|---|---|---|---|---|
| 0 | 1ff7f10f-a204-4bb1-aa72-dd763fa99482 | True | False | 2020-03-01 | NaN | 2017-08-24 | M | False | False |
| 1 | 9bcf6ed5-d808-44af-98a0-7d78a29ede72 | True | False | 2020-03-13 | NaN | 2016-08-01 | F | False | False |
Grab all of the conditions starting after January 20, 2020. This is a hack to get only conditions that are related to COVID-19. We will end up merging these with the COVID patients.
covid_related_conditions = conditions[pd.to_datetime(conditions.START) > pd.to_datetime('2020-01-20')]This DataFrame will contain all conditions for COVID-19 patients, where START can be compared to covid_start to see how long after the COVID-19 diagnosis something happened.
covid_patient_conditions = covid_info.merge(covid_related_conditions, on='PATIENT')
covid_patient_conditions.head(2)| PATIENT | recovered | death | covid_start | DEATHDATE | BIRTHDATE | GENDER | admit | icu_admit | START | STOP | ENCOUNTER | CODE | DESCRIPTION | |
|---|---|---|---|---|---|---|---|---|---|---|---|---|---|---|
| 0 | 1ff7f10f-a204-4bb1-aa72-dd763fa99482 | True | False | 2020-03-01 | NaN | 2017-08-24 | M | False | False | 2020-03-01 | 2020-03-30 | 60584c6a-e26b-4176-a660-86ad84c7ceca | 386661006 | Fever (finding) |
| 1 | 1ff7f10f-a204-4bb1-aa72-dd763fa99482 | True | False | 2020-03-01 | NaN | 2017-08-24 | M | False | False | 2020-03-01 | 2020-03-01 | 60584c6a-e26b-4176-a660-86ad84c7ceca | 840544004 | Suspected COVID-19 |
9.0.7 Lab values for COVID-19 patients
The following code presents lab values taken for COVID-19 patients. Values are separated into survivors and non survivors. The first block of code selects lab values of interest from all observations in the simulation.
lab_obs = observations[(observations.CODE == '48065-7') | (observations.CODE == '26881-3') |
                          (observations.CODE == '2276-4') | (observations.CODE == '89579-7') |
                           (observations.CODE == '731-0') | (observations.CODE == '14804-9')
                      ]
lab_obs.head(3)| DATE | PATIENT | ENCOUNTER | CODE | DESCRIPTION | VALUE | UNITS | TYPE | |
|---|---|---|---|---|---|---|---|---|
| 254 | 2020-02-19 | bd1c4ffc-7f1d-4590-adbb-1d6533fb623e | b7455838-3607-47f4-aaa5-fd89abea7d29 | 731-0 | Lymphocytes [#/volume] in Blood by Automated c... | 1.1 | 10*3/uL | numeric |
| 273 | 2020-02-19 | bd1c4ffc-7f1d-4590-adbb-1d6533fb623e | b7455838-3607-47f4-aaa5-fd89abea7d29 | 48065-7 | Fibrin D-dimer FEU [Mass/volume] in Platelet p... | 0.4 | ug/mL | numeric |
| 274 | 2020-02-19 | bd1c4ffc-7f1d-4590-adbb-1d6533fb623e | b7455838-3607-47f4-aaa5-fd89abea7d29 | 2276-4 | Ferritin [Mass/volume] in Serum or Plasma | 332.4 | ug/L | numeric |
Select COVID-19 conditions out of all conditions in the simulation
covid_conditions = conditions[conditions.CODE == 840539006]
covid_patients = covid_conditions.merge(patients, how='left', left_on='PATIENT', right_on='Id')
covid_patients['survivor'] = covid_patients.PATIENT.isin(survivor_ids)
covid_patients = covid_patients[['START', 'PATIENT', 'survivor', 'CODE']]
Calculate attributes needed to support the plot. Also coerce all lab values into a numeric data type.
covid_patients_obs = covid_patients.merge(lab_obs, on='PATIENT')
covid_patients_obs['START'] = pd.to_datetime(covid_patients_obs.START)
covid_patients_obs['DATE'] = pd.to_datetime(covid_patients_obs.DATE)
covid_patients_obs['lab_days'] = covid_patients_obs.DATE - covid_patients_obs.START
covid_patients_obs['days'] = covid_patients_obs.lab_days / np.timedelta64(1, 'D')
covid_patients_obs['VALUE'] = pd.to_numeric(covid_patients_obs['VALUE'], errors='coerce')
loinc_to_display = {'CODE_y = 48065-7': 'D-dimer', 'CODE_y = 2276-4': 'Serum Ferritin',
'CODE_y = 89579-7': 'High Sensitivity Cardiac Troponin I',
'CODE_y = 26881-3': 'IL-6', 'CODE_y = 731-0': 'Lymphocytes',
'CODE_y = 14804-9': 'Lactate dehydrogenase'}
catplt = sns.catplot(x="days", y="VALUE", hue="survivor", kind="box", col='CODE_y',
col_wrap=2, sharey=False, sharex=False, data=covid_patients_obs, palette=["C1", "C0"])
# Set the title for the entire figure
catplt.fig.suptitle("Labs Values of Covid-19 Patients", y=1.02)
for axis in catplt.fig.axes:
axis.xaxis.set_major_formatter(ticker.FormatStrFormatter('%d'))
axis.xaxis.set_major_locator(ticker.MultipleLocator(base=4))
axis.set_title(loinc_to_display[axis.get_title()])
plt.show()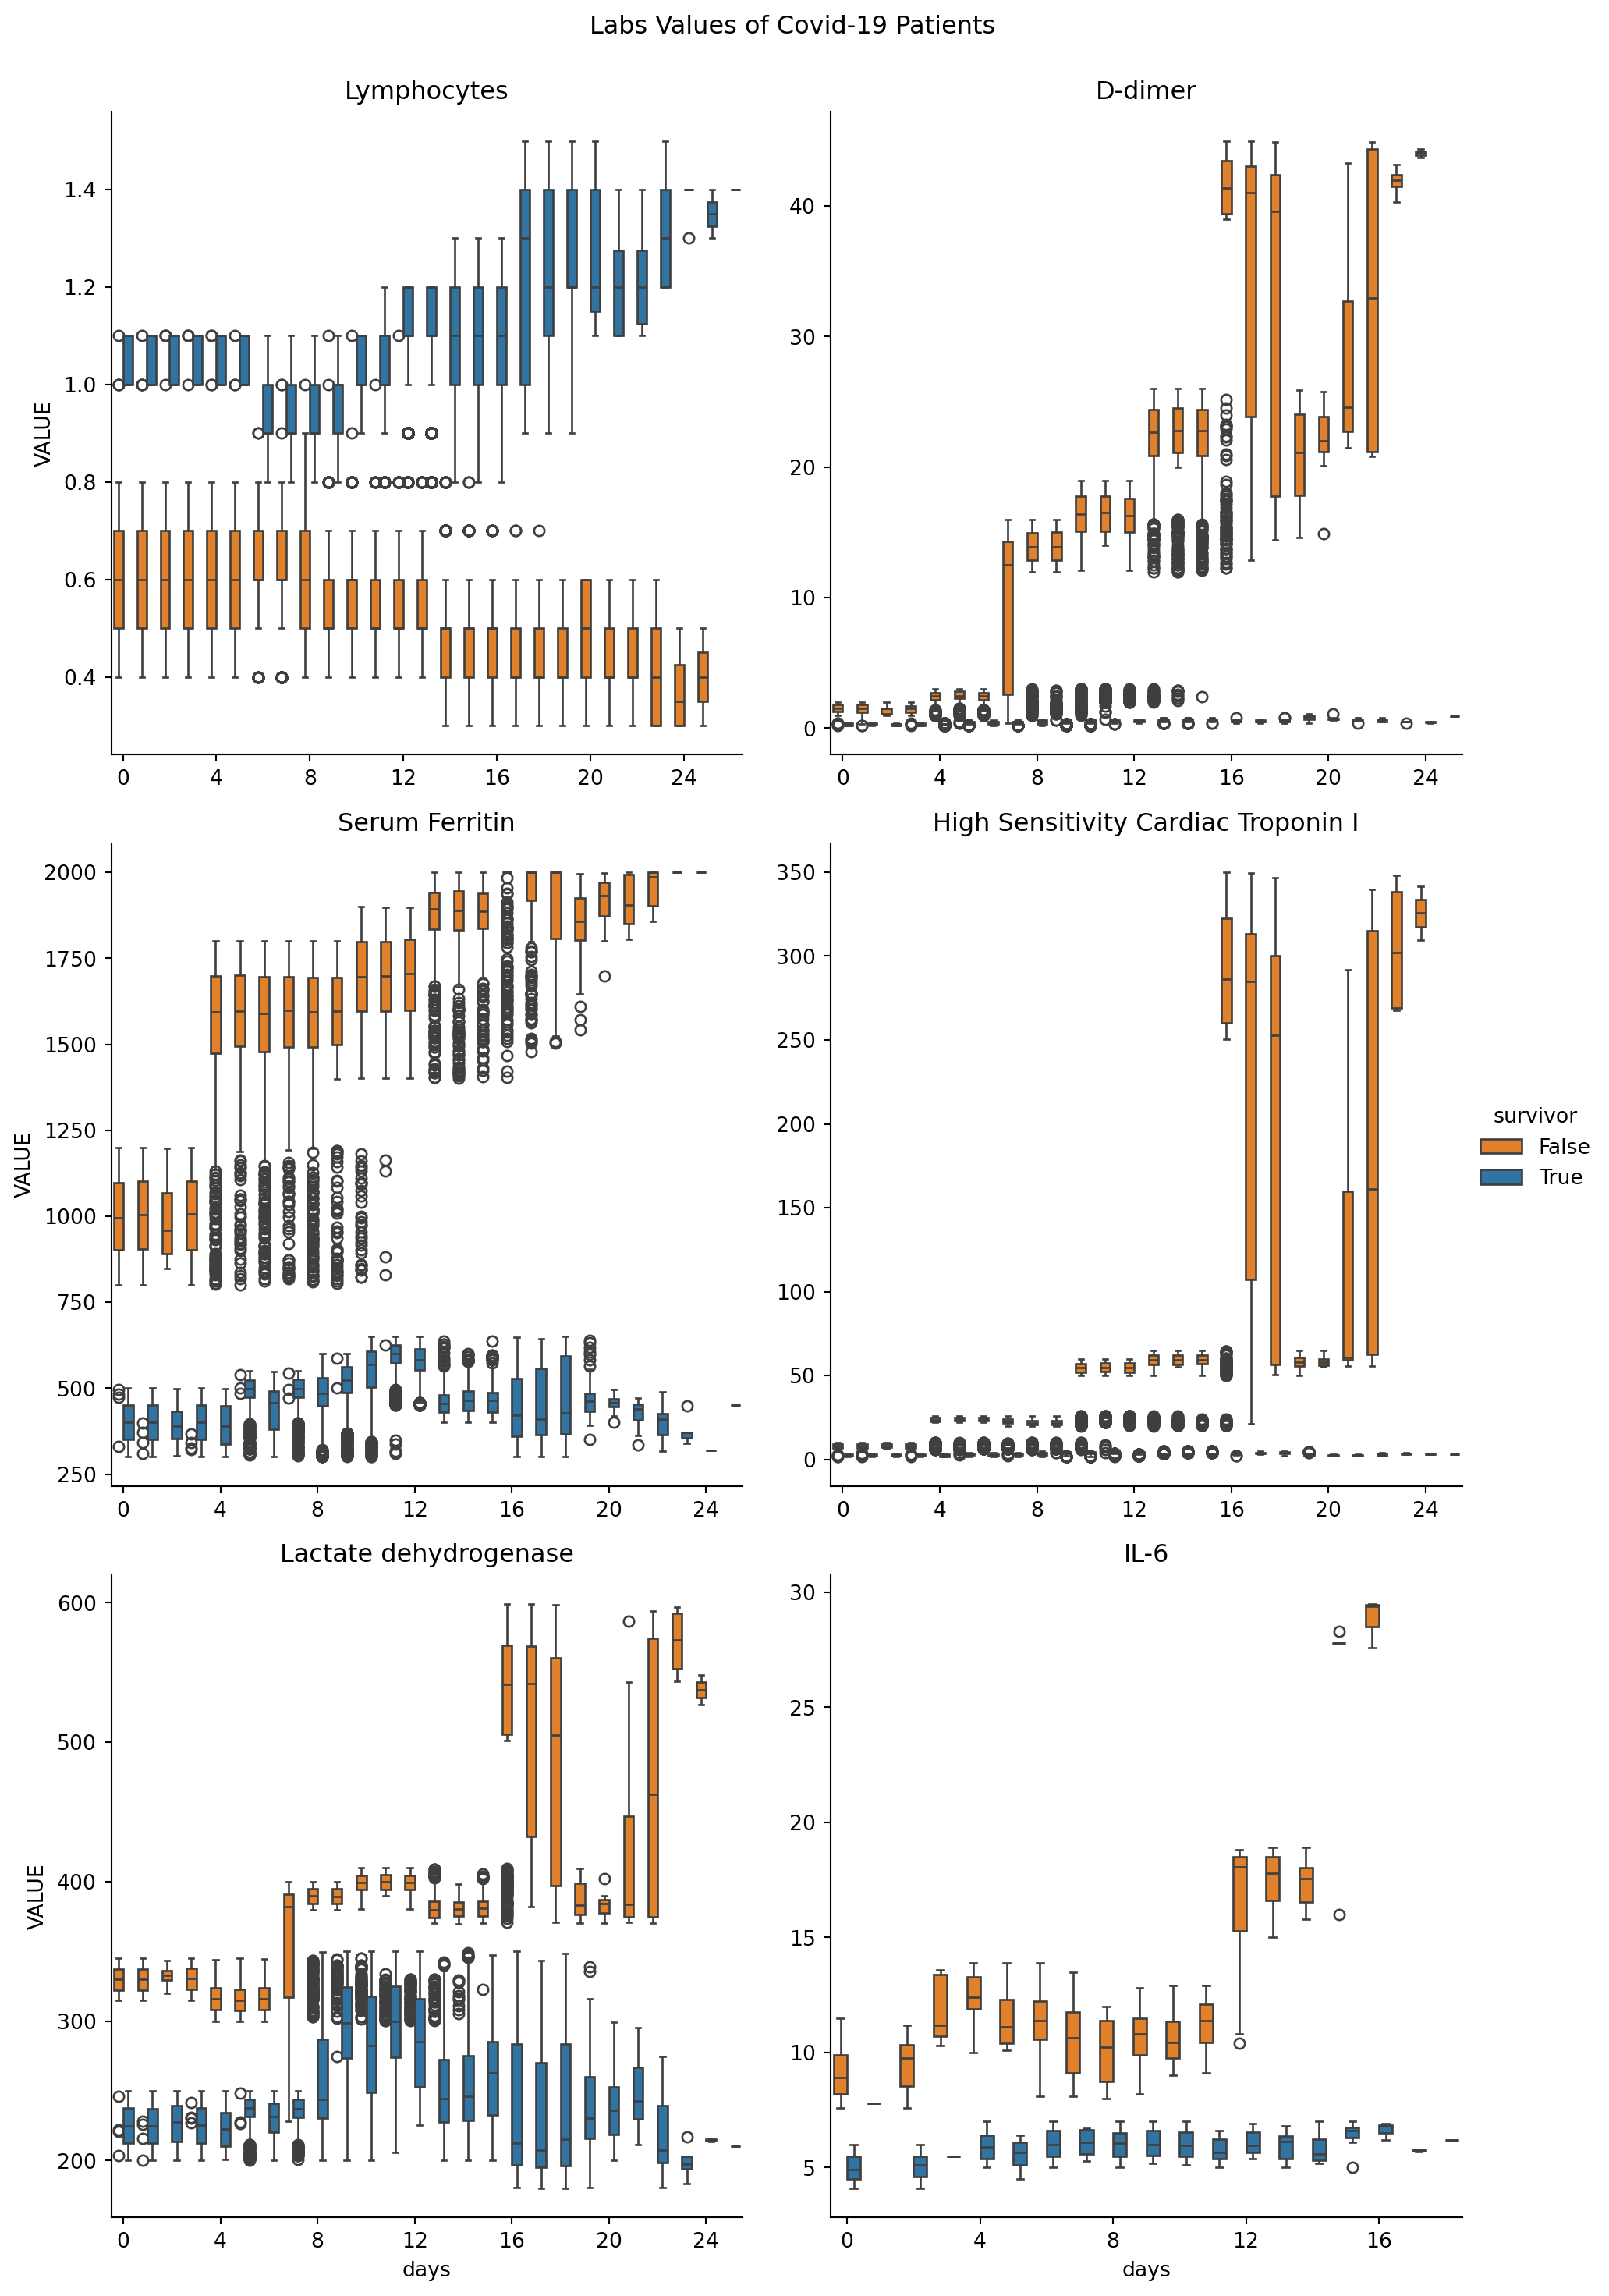
Line plot
loinc_to_display = {'CODE_y = 48065-7': 'D-dimer', 'CODE_y = 2276-4': 'Serum Ferritin',
                    'CODE_y = 89579-7': 'High Sensitivity Cardiac Troponin I',
                    'CODE_y = 26881-3': 'IL-6', 'CODE_y = 731-0': 'Lymphocytes',
                    'CODE_y = 14804-9': 'Lactate dehydrogenase'}
g = sns.FacetGrid(covid_patients_obs, col="CODE_y", col_wrap=2, sharey=False, height=3, aspect=2)
g = g.map_dataframe(sns.lineplot, x="days", y="VALUE", marker=".", hue="survivor", palette=["C1", "C0"], alpha=0.5)
g.fig.suptitle("Labs Values of Covid-19 Patients", y=1.02)

for axis in g.axes.flat:
    axis.xaxis.set_major_formatter(ticker.FormatStrFormatter('%d'))
    axis.xaxis.set_major_locator(ticker.MultipleLocator(base=4))
    title = axis.get_title().replace("DESCRIPTION = ", "").strip()
    if title in loinc_to_display:
        axis.set_title(loinc_to_display[title])
    else:
        axis.set_title(title)

plt.show()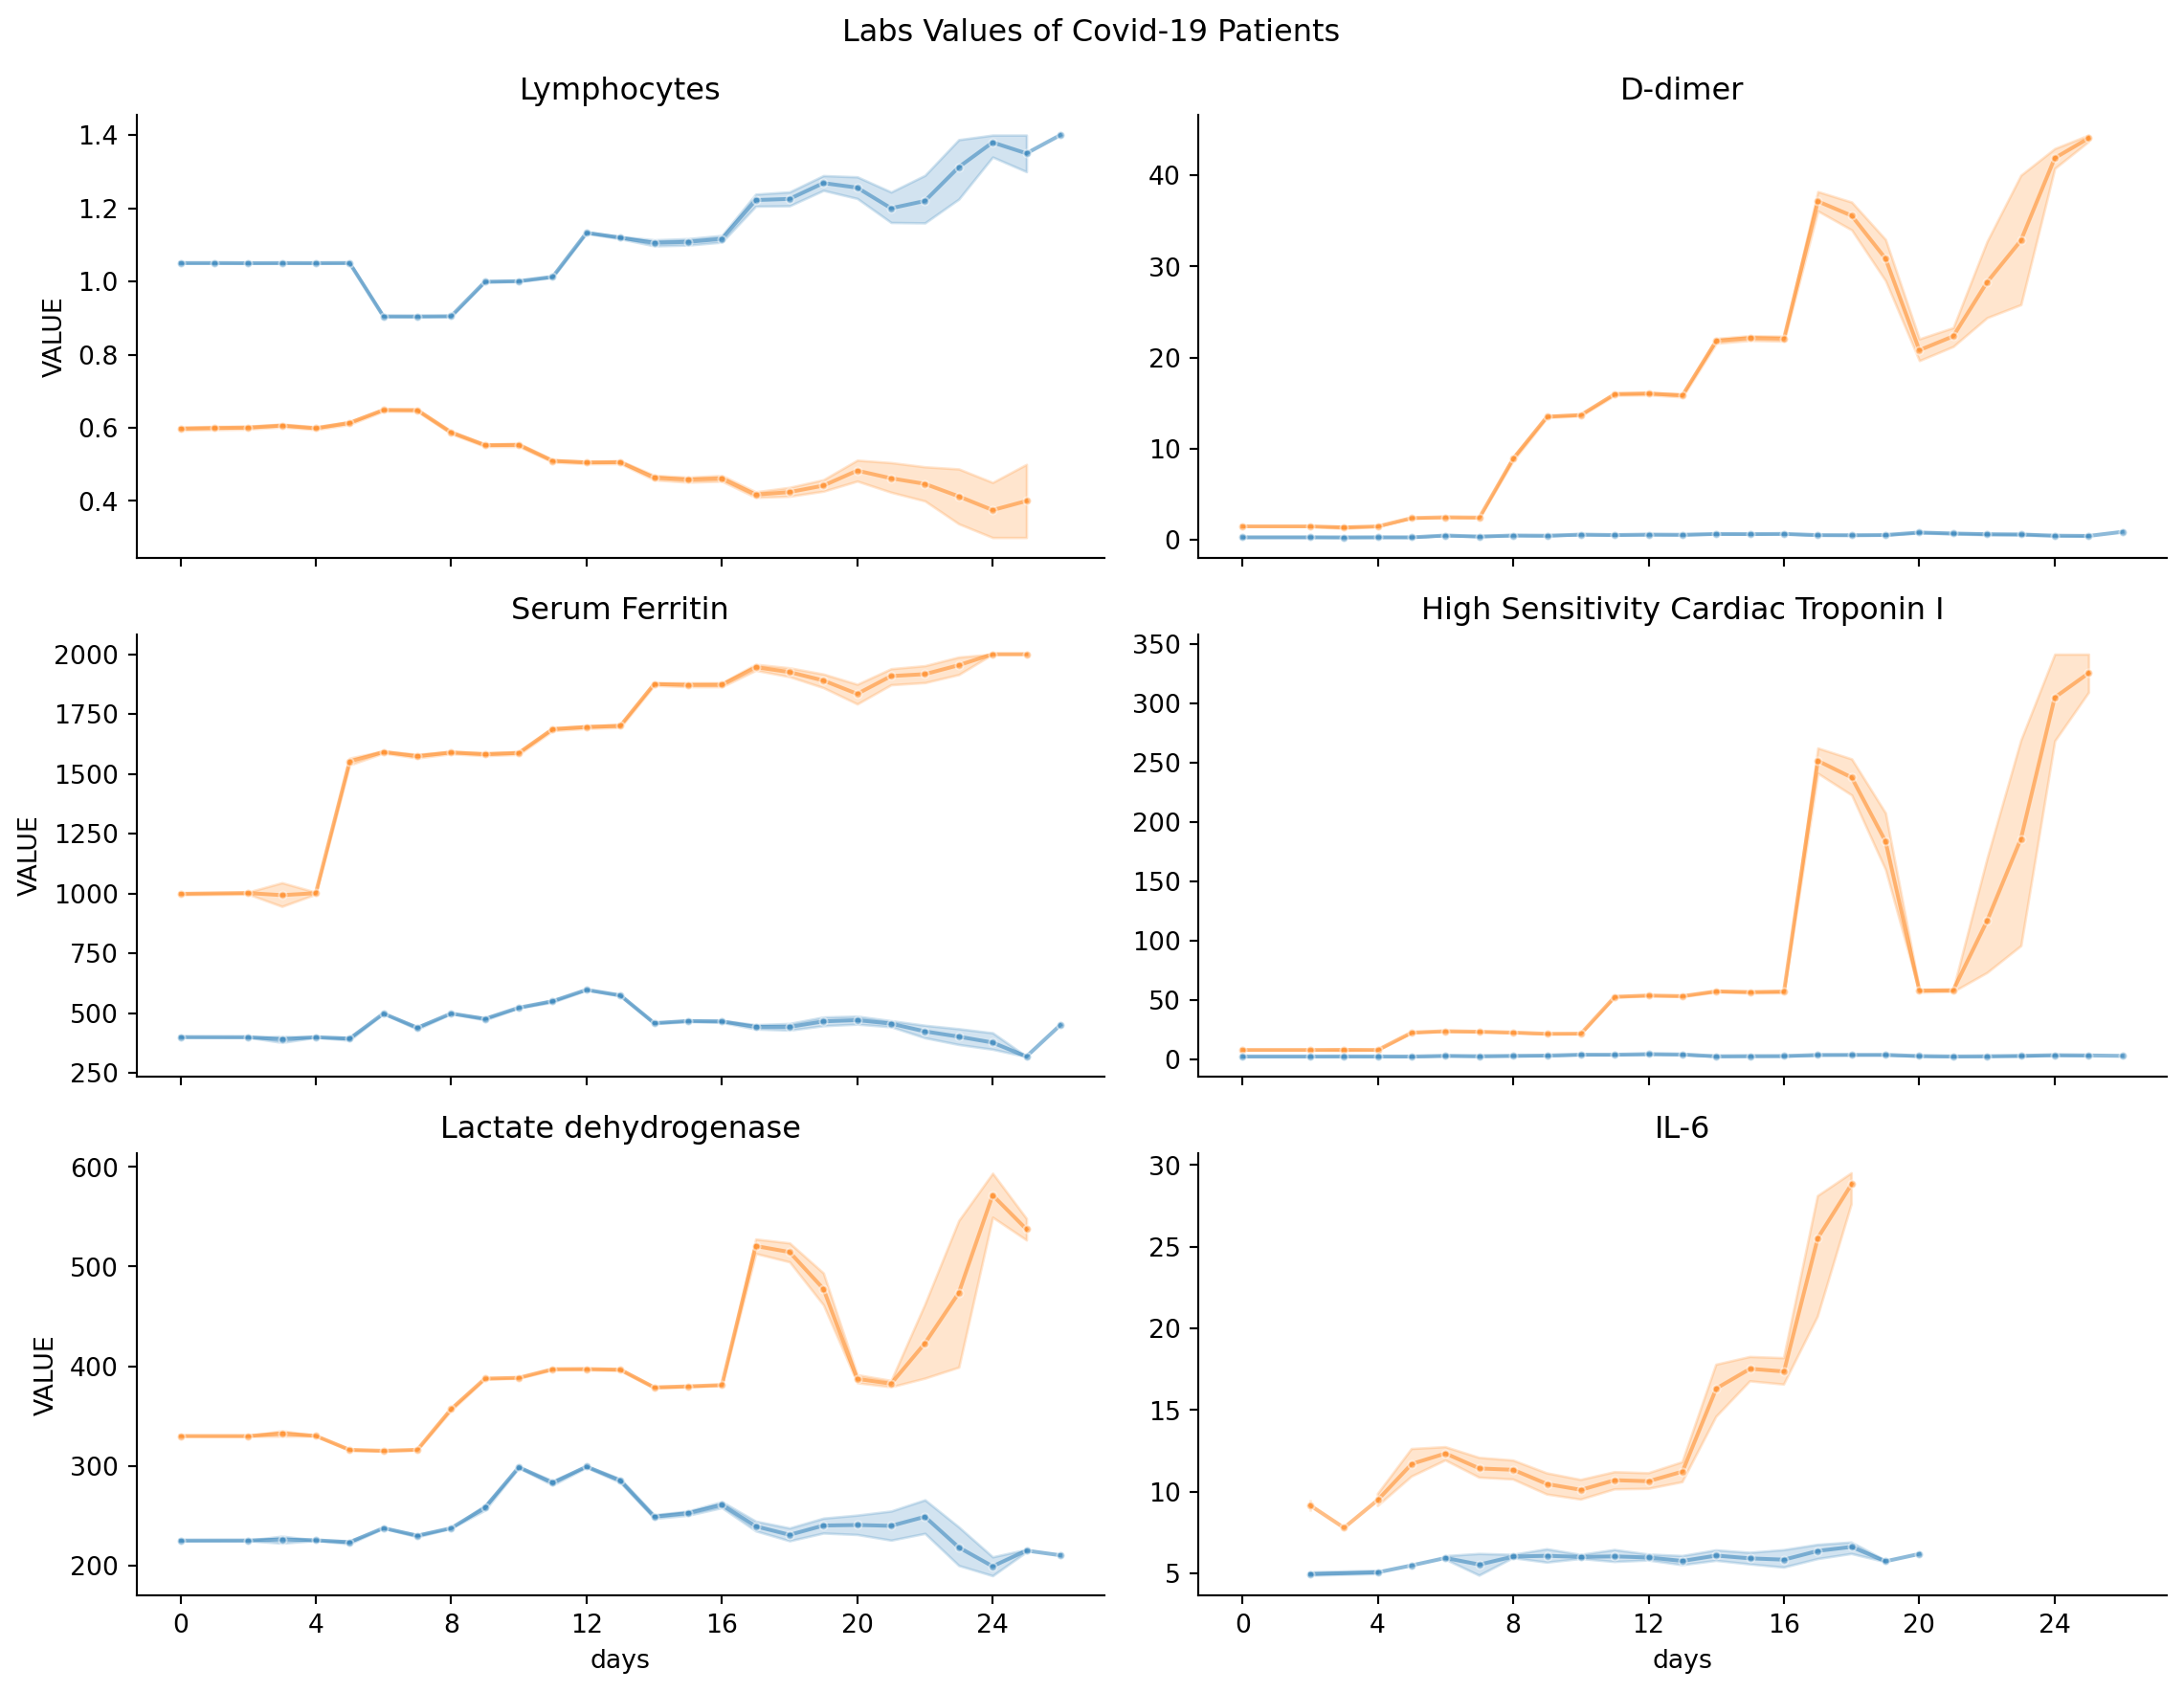
Line plot with a different style
loinc_to_display = {'CODE_y = 48065-7': 'D-dimer', 'CODE_y = 2276-4': 'Serum Ferritin',
                    'CODE_y = 89579-7': 'High Sensitivity Cardiac Troponin I',
                    'CODE_y = 26881-3': 'IL-6', 'CODE_y = 731-0': 'Lymphocytes',
                    'CODE_y = 14804-9': 'Lactate dehydrogenase'}
catplt = sns.catplot(x="days", y="VALUE", hue="survivor", kind="point", col='CODE_y',
            col_wrap=2, sharey=False, sharex=False, data=covid_patients_obs, palette=["C1", "C0"])


# Set the title for the entire figure
catplt.fig.suptitle("Labs Values of Covid-19 Patients", y=1.02)

for axis in catplt.fig.axes:
    axis.xaxis.set_major_formatter(ticker.FormatStrFormatter('%d'))
    axis.xaxis.set_major_locator(ticker.MultipleLocator(base=4))
    axis.set_title(loinc_to_display[axis.title.get_text()])

plt.show()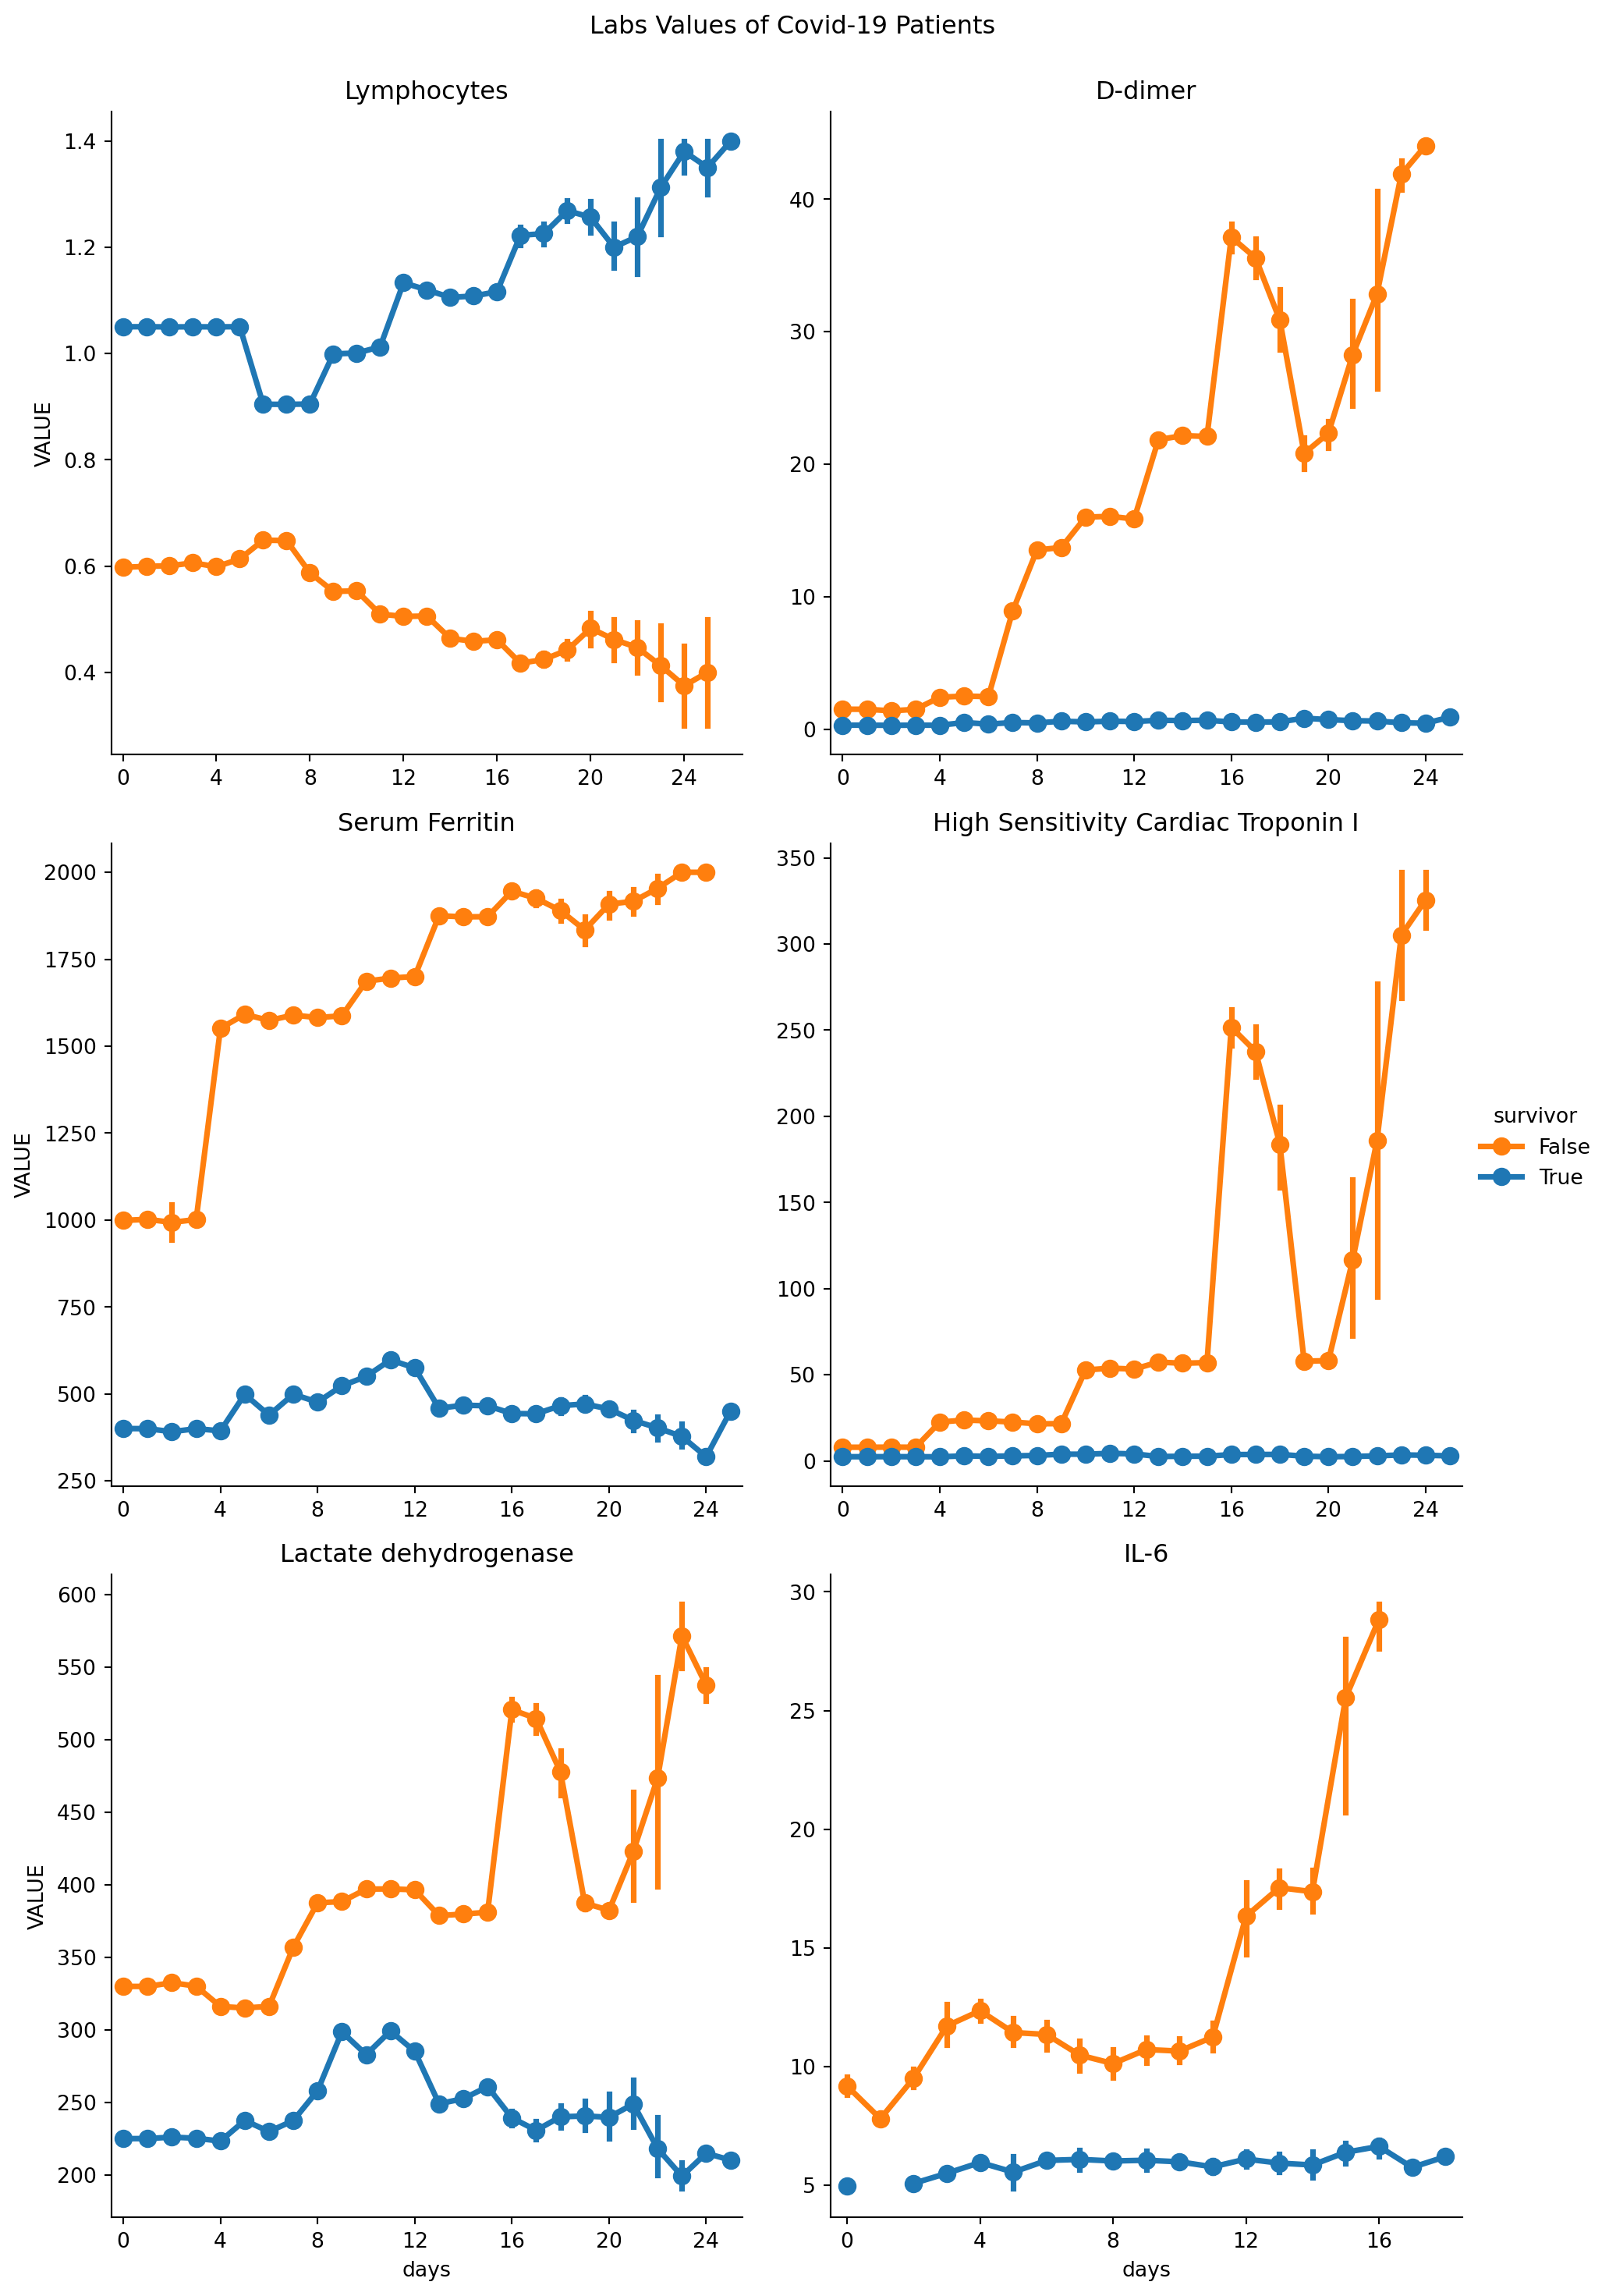
Set up a new DataFrame with boolean columns representing various outcomes, like admit, recovery or death
First, create patient Ids for ‘isolation’, ‘admitted’, ‘icu_admitted’, ‘ventilated’, ‘recovered’ and ‘death’, then create related columns in the covid_patient_ids table.
cp = covid_conditions.merge(patients, how='left', left_on='PATIENT', right_on='Id')
isolation_ids = care_plans[(care_plans.CODE == 736376001) & (care_plans.REASONCODE == 840539006)].PATIENT

cp['isolation'] = cp.Id.isin(isolation_ids)
cp['admit'] = cp.Id.isin(inpatient_ids)
cp['recovered'] = cp.Id.isin(survivor_ids)
cp['death'] = cp.DEATHDATE.notna()
icu_ids = encounters[encounters.CODE == 305351004].PATIENT
cp['icu_admit'] = cp.Id.isin(icu_ids)
vent_ids = procedures[procedures.CODE == 26763009].PATIENT
cp['ventilated'] = cp.Id.isin(vent_ids)
cp.head(2)| START | STOP | PATIENT | ENCOUNTER | CODE | DESCRIPTION | Id | BIRTHDATE | DEATHDATE | SSN | DRIVERS | PASSPORT | PREFIX | FIRST | LAST | SUFFIX | MAIDEN | MARITAL | RACE | ETHNICITY | GENDER | BIRTHPLACE | ADDRESS | CITY | STATE | COUNTY | ZIP | LAT | LON | HEALTHCARE_EXPENSES | HEALTHCARE_COVERAGE | isolation | admit | recovered | death | icu_admit | ventilated | |
|---|---|---|---|---|---|---|---|---|---|---|---|---|---|---|---|---|---|---|---|---|---|---|---|---|---|---|---|---|---|---|---|---|---|---|---|---|---|
| 0 | 2020-03-01 | 2020-03-30 | 1ff7f10f-a204-4bb1-aa72-dd763fa99482 | 60584c6a-e26b-4176-a660-86ad84c7ceca | 840539006 | COVID-19 | 1ff7f10f-a204-4bb1-aa72-dd763fa99482 | 2017-08-24 | NaN | 999-68-6630 | NaN | NaN | NaN | Jacinto644 | Kris249 | NaN | NaN | NaN | white | nonhispanic | M | Beverly Massachusetts US | 888 Hickle Ferry Suite 38 | Springfield | Massachusetts | Hampden County | 1106.0 | 42.151961 | -72.598959 | 8446.49 | 1499.08 | True | False | True | False | False | False |
| 1 | 2020-03-13 | 2020-04-14 | 9bcf6ed5-d808-44af-98a0-7d78a29ede72 | a78e78d9-33bb-40bc-9e42-e47ff7e910cc | 840539006 | COVID-19 | 9bcf6ed5-d808-44af-98a0-7d78a29ede72 | 2016-08-01 | NaN | 999-15-5895 | NaN | NaN | NaN | Alva958 | Krajcik437 | NaN | NaN | NaN | white | nonhispanic | F | Boston Massachusetts US | 1048 Skiles Trailer | Walpole | Massachusetts | Norfolk County | 2081.0 | 42.177370 | -71.281353 | 94568.40 | 1870.72 | True | False | True | False | False | False |
9.0.8 Symptoms for all COVID-19 Patients
Generates a DataFrame with percentages of co-occurring conditions
icu_patient_ids = encounters[(encounters.REASONCODE == 840539006) & (encounters.CODE == 305351004)].PATIENT
icu_patient_ids.shape(3677,)def symptom_table(inpatient_ids, survivor_ids, deceased_ids, covid_cons):
# Filter conditions containing "(disorder)" in the DESCRIPTION
disorder_conditions = covid_cons[
(covid_cons['DESCRIPTION'].str.contains(r'\(finding\)', na=False)) &
(~covid_cons['DESCRIPTION'].str.contains(
r'pneumonia|hypoxemia|chronic|Hypertriglyceridemia|Hyperlipidemia|Hypercholesterolemia|Metabolic|osteoporosis|Alzheimer|Anemia|sinusitis|thrombosis|embolism|pharyngitis|bronchitis', case=False, na=False))
]
# Initialize the result table
table_rows = []
for outcome in disorder_conditions['DESCRIPTION'].unique():
# Filter patients with the specific outcome
outcome_patients = disorder_conditions[disorder_conditions['DESCRIPTION']
== outcome]['PATIENT'].unique()
# Calculate metrics
total = len(outcome_patients)
inpatient = len(set(outcome_patients) & set(inpatient_ids))
survivors = len(set(outcome_patients) & set(survivor_ids))
non_survivors = len(set(outcome_patients) & set(deceased_ids))
percent_inpatient = (inpatient / len(inpatient_ids)) * \
100 if len(inpatient_ids) > 0 else 0
percent_survivors = (survivors / len(survivor_ids)) * \
100 if len(survivor_ids) > 0 else 0
percent_non_survivors = (
non_survivors / len(deceased_ids)) * 100 if len(deceased_ids) > 0 else 0
# Append row to the table
table_rows.append({
'outcome': outcome,
'total': total,
'percent of inpatient': round(percent_inpatient, 2),
'survivors': survivors,
'percent survivors': round(percent_survivors, 2),
'non survivors': non_survivors,
'percent non survivors': round(percent_non_survivors, 2)
})
# Convert to DataFrame
outcome_table = pd.DataFrame(table_rows).head(10)
outcome_table = outcome_table.sort_values(by='total', ascending=False)
outcome_table['outcome'] = outcome_table['outcome'].str.replace(
r'\(finding\)', '', regex=True).str.strip()
return outcome_table
symptom_table(inpatient_ids, survivor_ids, deceased_ids, covid_cons)| outcome | total | percent of inpatient | survivors | percent survivors | non survivors | percent non survivors | |
|---|---|---|---|---|---|---|---|
| 0 | Fever | 80865 | 92.07 | 77629 | 88.73 | 3317 | 13.73 |
| 1 | Cough | 61710 | 70.81 | 59170 | 67.63 | 2601 | 10.77 |
| 4 | Loss of taste | 46121 | 51.25 | 44299 | 50.64 | 1868 | 7.73 |
| 8 | Fatigue | 34951 | 39.86 | 33551 | 38.35 | 1432 | 5.93 |
| 2 | Sputum finding | 30653 | 34.78 | 29418 | 33.63 | 1264 | 5.23 |
| 7 | Respiratory distress | 18177 | 100.00 | 14654 | 16.75 | 3548 | 14.69 |
| 5 | Dyspnea | 17939 | 37.86 | 16621 | 19.00 | 1339 | 5.54 |
| 6 | Wheezing | 17939 | 37.86 | 16621 | 19.00 | 1339 | 5.54 |
| 3 | Diarrhea symptom | 3521 | 5.80 | 3319 | 3.79 | 208 | 0.86 |
| 9 | Hemoptysis | 874 | 2.56 | 781 | 0.89 | 95 | 0.39 |
9.0.9 Symptoms for ICU-admitted COVID-19 Patients
covid_conditions = covid_cons
icu_patient_ids = encounters[(encounters.REASONCODE == 840539006) & (encounters.CODE == 305351004)].PATIENT
icu_patients = covid_conditions[covid_conditions.PATIENT.isin(icu_patient_ids)]
len(icu_patient_ids)3677def calculate_symptom_stats(icu_patient_ids, survivor_ids, deceased_ids, covid_conditions):
# Filter conditions for "(finding)" only
finding_conditions = covid_conditions[
covid_conditions['DESCRIPTION'].str.contains(r'\(finding\)', na=False)
]
# Ensure there are symptoms to process
if finding_conditions.empty:
print("No symptoms found with '(finding)' in the description.")
return pd.DataFrame(columns=[
'symptom', 'icu_count', 'percent_icu',
'survivor_count', 'percent_survivor',
'deceased_count', 'percent_deceased'
])
# Convert inputs to sets for faster lookup
icu_set = set(icu_patient_ids)
survivor_set = set(survivor_ids)
deceased_set = set(deceased_ids)
table_rows = []
for symptom in finding_conditions['DESCRIPTION'].unique():
# Get all patients with the symptom
symptom_patients = finding_conditions[
finding_conditions['DESCRIPTION'] == symptom
]['PATIENT'].unique()
symptom_patients_set = set(symptom_patients)
# Intersections
icu_with_symptom = symptom_patients_set & icu_set
survivors_with_symptom = icu_with_symptom & survivor_set
deceased_with_symptom = icu_with_symptom & deceased_set
icu_count = len(icu_with_symptom)
survivor_count = len(survivors_with_symptom)
deceased_count = len(deceased_with_symptom)
# Safe percentage calculations
percent_icu = (icu_count / len(icu_patient_ids)) * 100 if len(icu_patient_ids) > 0 else 0
percent_survivor = (survivor_count / len(survivor_ids)) * 100 if len(survivor_ids) > 0 else 0
percent_deceased = (deceased_count / len(deceased_ids)) * 100 if len(deceased_ids) > 0 else 0
table_rows.append({
'symptom': symptom.replace('(finding)', '').strip(),
'icu_count': icu_count,
'percent_icu': round(percent_icu, 2),
'survivor_count': survivor_count,
'percent_survivor': round(percent_survivor, 2),
'deceased_count': deceased_count,
'percent_deceased': round(percent_deceased, 2)
})
# Create and sort the DataFrame
df = pd.DataFrame(table_rows)
if df.empty:
print("No matching symptoms found for ICU patients.")
return pd.DataFrame(columns=[
'symptom', 'icu_count', 'percent_icu',
'survivor_count', 'percent_survivor',
'deceased_count', 'percent_deceased'
])
df = df.sort_values(by='icu_count', ascending=False).head(10)
return df
# Call the function
calculate_symptom_stats(icu_patient_ids, survivor_ids, deceased_ids, covid_conditions)| symptom | icu_count | percent_icu | survivor_count | percent_survivor | deceased_count | percent_deceased | |
|---|---|---|---|---|---|---|---|
| 7 | Respiratory distress | 3677 | 100.00 | 1180 | 1.35 | 2498 | 10.34 |
| 0 | Fever | 3345 | 90.97 | 1068 | 1.22 | 2278 | 9.43 |
| 1 | Cough | 2637 | 71.72 | 853 | 0.98 | 1785 | 7.39 |
| 4 | Loss of taste | 1940 | 52.76 | 637 | 0.73 | 1303 | 5.40 |
| 8 | Fatigue | 1482 | 40.30 | 498 | 0.57 | 985 | 4.08 |
| 5 | Dyspnea | 1381 | 37.56 | 466 | 0.53 | 916 | 3.79 |
| 6 | Wheezing | 1381 | 37.56 | 466 | 0.53 | 916 | 3.79 |
| 2 | Sputum finding | 1271 | 34.57 | 401 | 0.46 | 870 | 3.60 |
| 11 | Muscle pain | 656 | 17.84 | 205 | 0.23 | 451 | 1.87 |
| 12 | Joint pain | 656 | 17.84 | 205 | 0.23 | 451 | 1.87 |
Create a DataFrame with columns that show a condition’s start and end in days relative to COVID-19 diagnosis. Also create a column that calculates the number of days between COVID-19 diagnosis and a person’s death.
covid_patient_conditions['start_days'] = (pd.to_datetime(covid_patient_conditions.START) - pd.to_datetime(covid_patient_conditions.covid_start)) / np.timedelta64(1, 'D')
covid_patient_conditions['end_days'] = (pd.to_datetime(covid_patient_conditions.STOP) - pd.to_datetime(covid_patient_conditions.covid_start)) / np.timedelta64(1, 'D')
covid_patient_conditions['death_days'] = (pd.to_datetime(covid_patient_conditions.DEATHDATE) - pd.to_datetime(covid_patient_conditions.covid_start)) / np.timedelta64(1, 'D')

covid_patient_conditions = covid_patient_conditions[covid_patient_conditions['DESCRIPTION'].str.contains(r'\(finding\)', na=False)]
covid_patient_conditions.head(2)| PATIENT | recovered | death | covid_start | DEATHDATE | BIRTHDATE | GENDER | admit | icu_admit | START | STOP | ENCOUNTER | CODE | DESCRIPTION | start_days | end_days | death_days | |
|---|---|---|---|---|---|---|---|---|---|---|---|---|---|---|---|---|---|
| 0 | 1ff7f10f-a204-4bb1-aa72-dd763fa99482 | True | False | 2020-03-01 | NaN | 2017-08-24 | M | False | False | 2020-03-01 | 2020-03-30 | 60584c6a-e26b-4176-a660-86ad84c7ceca | 386661006 | Fever (finding) | 0.0 | 29.0 | NaN |
| 4 | 9bcf6ed5-d808-44af-98a0-7d78a29ede72 | True | False | 2020-03-13 | NaN | 2016-08-01 | F | False | False | 2020-03-13 | 2020-04-14 | a78e78d9-33bb-40bc-9e42-e47ff7e910cc | 49727002 | Cough (finding) | 0.0 | 32.0 | NaN |
# Step 1 & 2: Filter and remove duplicate patient-condition pairs
filtered = covid_patient_conditions[
    (covid_patient_conditions['death'] == False) &
    (covid_patient_conditions['icu_admit'] == True)
][['PATIENT', 'DESCRIPTION']].drop_duplicates()

# Step 3: Group by condition and count unique patients
df_survivor = filtered.groupby('DESCRIPTION') \
    .agg(survivor_count=('PATIENT', 'nunique')) \
    .reset_index()

# Step 4: Add percentage column
total_unique_patients = filtered['PATIENT'].nunique()
df_survivor['survivor_percent'] = round((df_survivor['survivor_count'] / total_unique_patients) * 100, 2)

# Step 5: Sort and take top 10
df_survivor = df_survivor.sort_values(by='survivor_count', ascending=False).head(15)
df_survivor| DESCRIPTION | survivor_count | survivor_percent | |
|---|---|---|---|
| 15 | Respiratory distress (finding) | 1179 | 100.00 |
| 6 | Fever (finding) | 1067 | 90.50 |
| 2 | Cough (finding) | 852 | 72.26 |
| 10 | Loss of taste (finding) | 637 | 54.03 |
| 5 | Fatigue (finding) | 497 | 42.15 |
| 19 | Wheezing (finding) | 465 | 39.44 |
| 4 | Dyspnea (finding) | 465 | 39.44 |
| 17 | Sputum finding (finding) | 401 | 34.01 |
| 9 | Joint pain (finding) | 205 | 17.39 |
| 11 | Muscle pain (finding) | 205 | 17.39 |
| 1 | Chill (finding) | 171 | 14.50 |
| 7 | Headache (finding) | 166 | 14.08 |
| 16 | Sore throat symptom (finding) | 139 | 11.79 |
| 13 | Nausea (finding) | 82 | 6.96 |
| 18 | Vomiting symptom (finding) | 82 | 6.96 |
# Step 1 & 2: Filter and remove duplicate patient-condition pairs
filtered = covid_patient_conditions[
    (covid_patient_conditions['death'] == True) &
    (covid_patient_conditions['icu_admit'] == True)
][['PATIENT', 'DESCRIPTION']].drop_duplicates()

# Step 3: Group by condition and count unique patients
df_death = filtered.groupby('DESCRIPTION') \
    .agg(death_count=('PATIENT', 'nunique')) \
    .reset_index()

# Step 4: Add percentage column
total_unique_patients = filtered['PATIENT'].nunique()
df_death['death_percent'] = round((df_death['death_count'] / total_unique_patients) * 100, 2)

# Step 5: Sort and take top 10
df_death = df_death.sort_values(by='death_count', ascending=False).head(15)
df_death| DESCRIPTION | death_count | death_percent | |
|---|---|---|---|
| 15 | Respiratory distress (finding) | 2498 | 100.00 |
| 6 | Fever (finding) | 2278 | 91.19 |
| 2 | Cough (finding) | 1785 | 71.46 |
| 10 | Loss of taste (finding) | 1303 | 52.16 |
| 5 | Fatigue (finding) | 985 | 39.43 |
| 19 | Wheezing (finding) | 916 | 36.67 |
| 4 | Dyspnea (finding) | 916 | 36.67 |
| 17 | Sputum finding (finding) | 870 | 34.83 |
| 9 | Joint pain (finding) | 451 | 18.05 |
| 11 | Muscle pain (finding) | 451 | 18.05 |
| 7 | Headache (finding) | 412 | 16.49 |
| 1 | Chill (finding) | 370 | 14.81 |
| 16 | Sore throat symptom (finding) | 348 | 13.93 |
| 13 | Nausea (finding) | 158 | 6.33 |
| 18 | Vomiting symptom (finding) | 158 | 6.33 |
# Step 1 & 2: Filter and remove duplicate patient-condition pairs
filtered = covid_patient_conditions[
    (covid_patient_conditions['icu_admit'] == True)
][['PATIENT', 'DESCRIPTION']].drop_duplicates()

# Step 3: Group by condition and count unique patients
df_total = filtered.groupby('DESCRIPTION') \
    .agg(total_count=('PATIENT', 'nunique')) \
    .reset_index()

# Step 4: Add percentage column
total_unique_patients = filtered['PATIENT'].nunique()
df_total['total_percent'] = round((df_total['total_count'] / total_unique_patients) * 100, 2)

# Step 5: Sort and take top 10
df_total = df_total.sort_values(by='total_count', ascending=False).head(15)
df_total| DESCRIPTION | total_count | total_percent | |
|---|---|---|---|
| 15 | Respiratory distress (finding) | 3677 | 100.00 |
| 6 | Fever (finding) | 3345 | 90.97 |
| 2 | Cough (finding) | 2637 | 71.72 |
| 10 | Loss of taste (finding) | 1940 | 52.76 |
| 5 | Fatigue (finding) | 1482 | 40.30 |
| 19 | Wheezing (finding) | 1381 | 37.56 |
| 4 | Dyspnea (finding) | 1381 | 37.56 |
| 17 | Sputum finding (finding) | 1271 | 34.57 |
| 9 | Joint pain (finding) | 656 | 17.84 |
| 11 | Muscle pain (finding) | 656 | 17.84 |
| 7 | Headache (finding) | 578 | 15.72 |
| 1 | Chill (finding) | 541 | 14.71 |
| 16 | Sore throat symptom (finding) | 487 | 13.24 |
| 13 | Nausea (finding) | 240 | 6.53 |
| 18 | Vomiting symptom (finding) | 240 | 6.53 |
# Merge df_total and df_survivor on 'DESCRIPTION'
merged_df = df_total.merge(df_survivor, on='DESCRIPTION', how='left')

# Merge the result with df_death on 'DESCRIPTION'
merged_df = merged_df.merge(df_death, on='DESCRIPTION', how='left')
merged_df['DESCRIPTION'] = merged_df['DESCRIPTION'].str.replace(
        r'\(finding\)', '', regex=True).str.strip()
# Display the merged DataFrame
merged_df.head(10)| DESCRIPTION | total_count | total_percent | survivor_count | survivor_percent | death_count | death_percent | |
|---|---|---|---|---|---|---|---|
| 0 | Respiratory distress | 3677 | 100.00 | 1179 | 100.00 | 2498 | 100.00 |
| 1 | Fever | 3345 | 90.97 | 1067 | 90.50 | 2278 | 91.19 |
| 2 | Cough | 2637 | 71.72 | 852 | 72.26 | 1785 | 71.46 |
| 3 | Loss of taste | 1940 | 52.76 | 637 | 54.03 | 1303 | 52.16 |
| 4 | Fatigue | 1482 | 40.30 | 497 | 42.15 | 985 | 39.43 |
| 5 | Wheezing | 1381 | 37.56 | 465 | 39.44 | 916 | 36.67 |
| 6 | Dyspnea | 1381 | 37.56 | 465 | 39.44 | 916 | 36.67 |
| 7 | Sputum finding | 1271 | 34.57 | 401 | 34.01 | 870 | 34.83 |
| 8 | Joint pain | 656 | 17.84 | 205 | 17.39 | 451 | 18.05 |
| 9 | Muscle pain | 656 | 17.84 | 205 | 17.39 | 451 | 18.05 |
Combined table
from functools import reduce

# --- TOTAL ICU PATIENTS ---
filtered_total = covid_patient_conditions[
    covid_patient_conditions['icu_admit'] == True
][['PATIENT', 'DESCRIPTION']].drop_duplicates()

df_total = (
    filtered_total
    .groupby('DESCRIPTION')
    .agg(total_count=('PATIENT', 'nunique'))
    .reset_index()
)

total_unique_patients = filtered_total['PATIENT'].nunique()
df_total['total_percent'] = round((df_total['total_count'] / total_unique_patients) * 100, 2)

# --- ICU SURVIVORS ---
filtered_survivor = covid_patient_conditions[
    (covid_patient_conditions['icu_admit'] == True) &
    (covid_patient_conditions['death'] == False)
][['PATIENT', 'DESCRIPTION']].drop_duplicates()

df_survivor = (
    filtered_survivor
    .groupby('DESCRIPTION')
    .agg(survivor_count=('PATIENT', 'nunique'))
    .reset_index()
)

survivor_unique_patients = filtered_survivor['PATIENT'].nunique()
df_survivor['survivor_percent'] = round((df_survivor['survivor_count'] / survivor_unique_patients) * 100, 2)

# --- ICU DEATHS ---
filtered_death = covid_patient_conditions[
    (covid_patient_conditions['icu_admit'] == True) &
    (covid_patient_conditions['death'] == True)
][['PATIENT', 'DESCRIPTION']].drop_duplicates()

df_death = (
    filtered_death
    .groupby('DESCRIPTION')
    .agg(death_count=('PATIENT', 'nunique'))
    .reset_index()
)

death_unique_patients = filtered_death['PATIENT'].nunique()
df_death['death_percent'] = round((df_death['death_count'] / death_unique_patients) * 100, 2)

# --- MERGE ALL ---
dfs = [df_total, df_survivor, df_death]
df_combined = reduce(lambda left, right: pd.merge(left, right, on='DESCRIPTION', how='outer'), dfs)

# Fill missing values with 0
df_combined = df_combined.fillna(0)

# Clean DESCRIPTION labels
df_combined['DESCRIPTION'] = (
    df_combined['DESCRIPTION']
    .str.replace(r'\(finding\)', '', regex=True)
    .str.strip()
)

# Sort and limit output
df_combined = df_combined.sort_values(by='total_count', ascending=False).head(10)

# Final result
df_combined.head(10)| DESCRIPTION | total_count | total_percent | survivor_count | survivor_percent | death_count | death_percent | |
|---|---|---|---|---|---|---|---|
| 15 | Respiratory distress | 3677 | 100.00 | 1179 | 100.00 | 2498 | 100.00 |
| 6 | Fever | 3345 | 90.97 | 1067 | 90.50 | 2278 | 91.19 |
| 2 | Cough | 2637 | 71.72 | 852 | 72.26 | 1785 | 71.46 |
| 10 | Loss of taste | 1940 | 52.76 | 637 | 54.03 | 1303 | 52.16 |
| 5 | Fatigue | 1482 | 40.30 | 497 | 42.15 | 985 | 39.43 |
| 19 | Wheezing | 1381 | 37.56 | 465 | 39.44 | 916 | 36.67 |
| 4 | Dyspnea | 1381 | 37.56 | 465 | 39.44 | 916 | 36.67 |
| 17 | Sputum finding | 1271 | 34.57 | 401 | 34.01 | 870 | 34.83 |
| 9 | Joint pain | 656 | 17.84 | 205 | 17.39 | 451 | 18.05 |
| 11 | Muscle pain | 656 | 17.84 | 205 | 17.39 | 451 | 18.05 |
9.0.10 Symptom timelines for hospitalized patients
These plots show the progression of COVID-19 related complications in hospitalized patients. The bars represent the average start and end time for the particular item.
covid_patient_conditions.head(2)| PATIENT | recovered | death | covid_start | DEATHDATE | BIRTHDATE | GENDER | admit | icu_admit | START | STOP | ENCOUNTER | CODE | DESCRIPTION | start_days | end_days | death_days | |
|---|---|---|---|---|---|---|---|---|---|---|---|---|---|---|---|---|---|
| 0 | 1ff7f10f-a204-4bb1-aa72-dd763fa99482 | True | False | 2020-03-01 | NaN | 2017-08-24 | M | False | False | 2020-03-01 | 2020-03-30 | 60584c6a-e26b-4176-a660-86ad84c7ceca | 386661006 | Fever (finding) | 0.0 | 29.0 | NaN |
| 4 | 9bcf6ed5-d808-44af-98a0-7d78a29ede72 | True | False | 2020-03-13 | NaN | 2016-08-01 | F | False | False | 2020-03-13 | 2020-04-14 | a78e78d9-33bb-40bc-9e42-e47ff7e910cc | 49727002 | Cough (finding) | 0.0 | 32.0 | NaN |
symptoms = ['Fever (finding)', 'Cough (finding)', 'Dyspnea (finding)']
filtered = covid_patient_conditions[(covid_patient_conditions['DESCRIPTION'].isin(symptoms)) &
    (covid_patient_conditions['icu_admit'] == True)]
filtered.groupby('DESCRIPTION')['end_days'].mean().round(2)
DESCRIPTION
Cough (finding) 16.29
Dyspnea (finding) 16.43
Fever (finding) 16.33
Name: end_days, dtype: float64# Create Boolean mask for "(finding)" and exclusion terms
condition_mask = (
covid_patient_conditions['DESCRIPTION'].str.contains(r'\(finding\)', na=False) &
~covid_patient_conditions['DESCRIPTION'].str.contains(
r'pneumonia|hypoxemia|chronic|Hypertriglyceridemia|Hyperlipidemia|Hypercholesterolemia|Metabolic|osteoporosis|Alzheimer|Anemia|sinusitis|thrombosis|embolism|pharyngitis|bronchitis',
case=False, na=False)
)
# Define function with additional filtering for specific descriptions
def select_condition_averages(df, mask):
mask = mask.reindex(df.index, fill_value=False)
filtered_df = df[mask]
# Filter for specific conditions only
symptoms = ['Fever (finding)', 'Cough (finding)', 'Dyspnea (finding)']
filtered_df = filtered_df[filtered_df['DESCRIPTION'].isin(symptoms)]
averages = filtered_df.groupby('DESCRIPTION').agg(
avg_start_days= ('start_days', 'mean'),
avg_end_days= ('end_days', 'mean'),
count=('PATIENT', 'size')
).reset_index()
return averages
# Apply function
averages = select_condition_averages(covid_patient_conditions, condition_mask)
# View result
averages.head(3)| DESCRIPTION | avg_start_days | avg_end_days | count | |
|---|---|---|---|---|
| 0 | Cough (finding) | -0.041698 | 22.529629 | 59763 |
| 1 | Dyspnea (finding) | -0.041395 | 20.302278 | 17514 |
| 2 | Fever (finding) | -0.041540 | 22.541085 | 78334 |
averages = select_condition_averages(
    covid_patient_conditions[
        (covid_patient_conditions['recovered'] == True) &
        (covid_patient_conditions['icu_admit'] == True)
    ],
    condition_mask
)
averages.head(3)| DESCRIPTION | avg_start_days | avg_end_days | count | |
|---|---|---|---|---|
| 0 | Cough (finding) | -0.046893 | 16.293083 | 853 |
| 1 | Dyspnea (finding) | -0.049356 | 16.431330 | 466 |
| 2 | Fever (finding) | -0.048689 | 16.327715 | 1068 |
averages = select_condition_averages(covid_patient_conditions[(covid_patient_conditions['death'] == True) & (covid_patient_conditions['icu_admit'] == True )], condition_mask)
averages.head(3)| DESCRIPTION | avg_start_days | avg_end_days | count | |
|---|---|---|---|---|
| 0 | Cough (finding) | -0.042017 | 21.0 | 1785 |
| 1 | Dyspnea (finding) | -0.036026 | 21.0 | 916 |
| 2 | Fever (finding) | -0.046971 | 21.0 | 2278 |
# Deaths of icu patients
np.intersect1d(icu_patient_ids, deceased_ids).shape[0]2498Add an age column to the DataFrame for rows where the patient has died
covid_info.loc[covid_info.death == True, 'age'] = (pd.to_datetime(covid_info.DEATHDATE) - pd.to_datetime(covid_info.BIRTHDATE)).dt.days / 365.25Populate ages for survivors based on the current date
covid_info.loc[covid_info.recovered == True, 'age'] = (datetime.datetime.now() - pd.to_datetime(covid_info.BIRTHDATE)).dt.days / 365.25Create an age_range column that places individuals into 10 year age ranges, such as 0 - 10, 10 - 20, etc.
bins = list(range(0, 120, 10))
covid_info['age_range'] = pd.cut(covid_info.age, bins=bins)
covid_info.head(3)| PATIENT | recovered | death | covid_start | DEATHDATE | BIRTHDATE | GENDER | admit | icu_admit | age | age_range | |
|---|---|---|---|---|---|---|---|---|---|---|---|
| 0 | 1ff7f10f-a204-4bb1-aa72-dd763fa99482 | True | False | 2020-03-01 | NaN | 2017-08-24 | M | False | False | 7.843943 | (0, 10] |
| 1 | 9bcf6ed5-d808-44af-98a0-7d78a29ede72 | True | False | 2020-03-13 | NaN | 2016-08-01 | F | False | False | 8.906229 | (0, 10] |
| 2 | 5163c501-353c-4a82-b863-a3f1df2d6cf1 | True | False | 2020-03-10 | NaN | 2004-01-09 | F | False | False | 21.467488 | (20, 30] |
9.0.11 Mortality by Age and Sex
A plot of deaths grouped by age range and gender.
# Mortality rate
rate = (np.intersect1d(covid_patient_ids, deceased_ids).shape[0]/len(covid_patient_ids))* 100
print(round(rate, 2),'% for all covid-19 patients')
4.13 % for all covid-19 patientschart = sns.catplot(x="age_range", kind="count", hue="GENDER", data=covid_info[covid_info.death == True])
for axes in chart.axes.flat:
axes.tick_params(axis='x', rotation=90)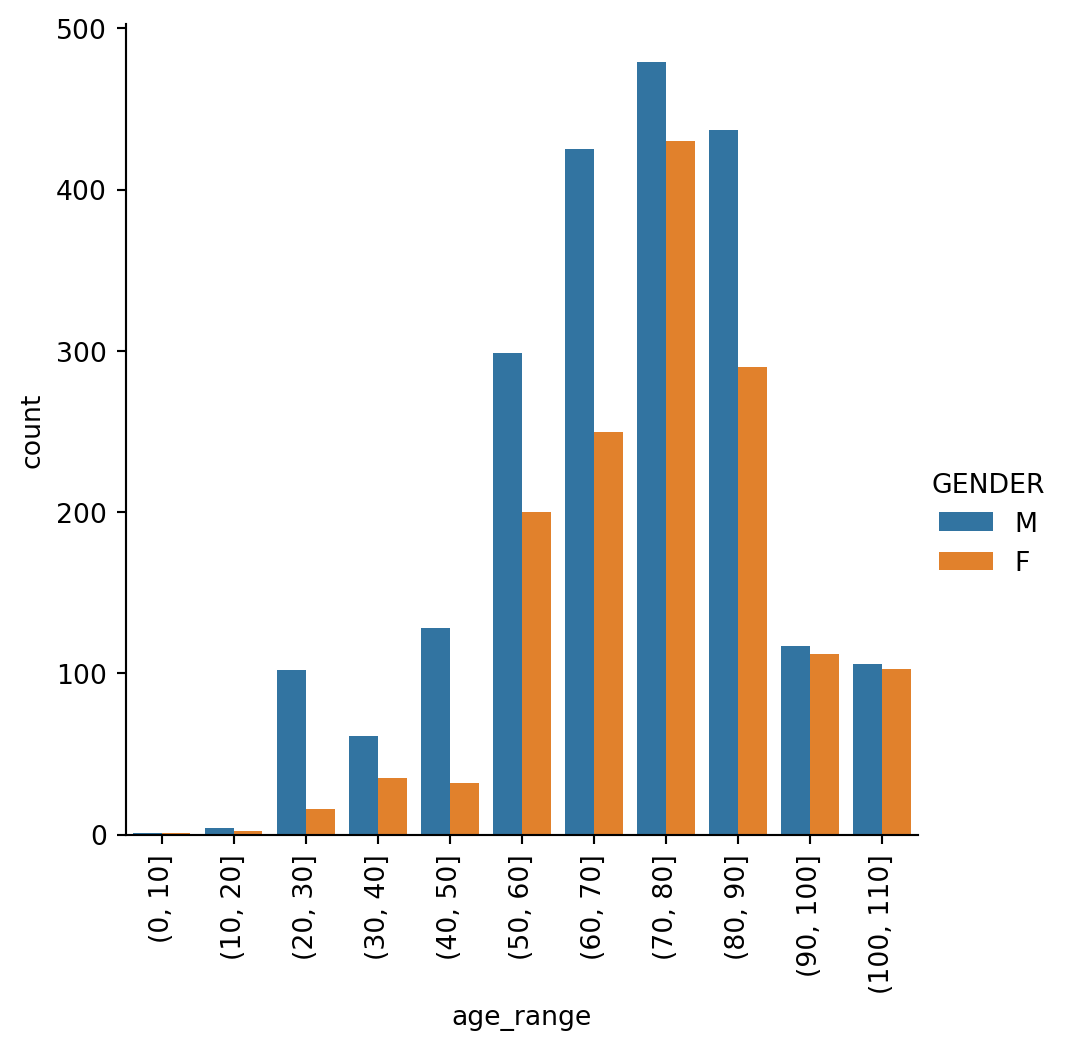
A table view of the same information from above
covid_info[covid_info.death==True].groupby(['age_range', 'GENDER'], observed=True).count()[['PATIENT']]| PATIENT | ||
|---|---|---|
| age_range | GENDER | |
| (0, 10] | F | 1 |
| M | 1 | |
| (10, 20] | F | 2 |
| M | 4 | |
| (20, 30] | F | 16 |
| M | 102 | |
| (30, 40] | F | 35 |
| M | 61 | |
| (40, 50] | F | 32 |
| M | 128 | |
| (50, 60] | F | 200 |
| M | 299 | |
| (60, 70] | F | 250 |
| M | 425 | |
| (70, 80] | F | 430 |
| M | 479 | |
| (80, 90] | F | 290 |
| M | 437 | |
| (90, 100] | F | 112 |
| M | 117 | |
| (100, 110] | F | 103 |
| M | 106 |
Another table view of the mortality data, this time just grouped by age range
covid_info[covid_info.death == True].groupby(['age_range'], observed=True).count()[['PATIENT']]| PATIENT | |
|---|---|
| age_range | |
| (0, 10] | 2 |
| (10, 20] | 6 |
| (20, 30] | 118 |
| (30, 40] | 96 |
| (40, 50] | 160 |
| (50, 60] | 499 |
| (60, 70] | 675 |
| (70, 80] | 909 |
| (80, 90] | 727 |
| (90, 100] | 229 |
| (100, 110] | 209 |
9.0.12 Supply use
supplies.head(3)
grouped_supplies = supplies.groupby(['DESCRIPTION', 'DATE']).sum()
import pandas as pd
import seaborn as sns
import matplotlib.pyplot as plt
# Prepare data
gs = grouped_supplies.reset_index()
gs['DATE'] = pd.to_datetime(gs['DATE'], errors='coerce') # Handle invalid dates safely
# Create FacetGrid
g = sns.FacetGrid(
data=gs,
col="DESCRIPTION",
col_wrap=3,
sharey=False,
height=3,
aspect=2
)
g.map_dataframe(sns.lineplot, x="DATE", y="QUANTITY", marker="o")
# Format titles and x-axis
for ax in g.axes.flat:
title = ax.get_title()
# Simplify and clean title
if 'glove' in title.lower():
ax.set_title('Gloves')
else:
cleaned_title = (
title.replace("DESCRIPTION = ", "")
.replace(" (physical object)", "")
.strip()
)
ax.set_title(cleaned_title)
# Rotate x-axis labels
for tick in ax.get_xticklabels():
tick.set_rotation(90)
plt.tight_layout()
plt.show()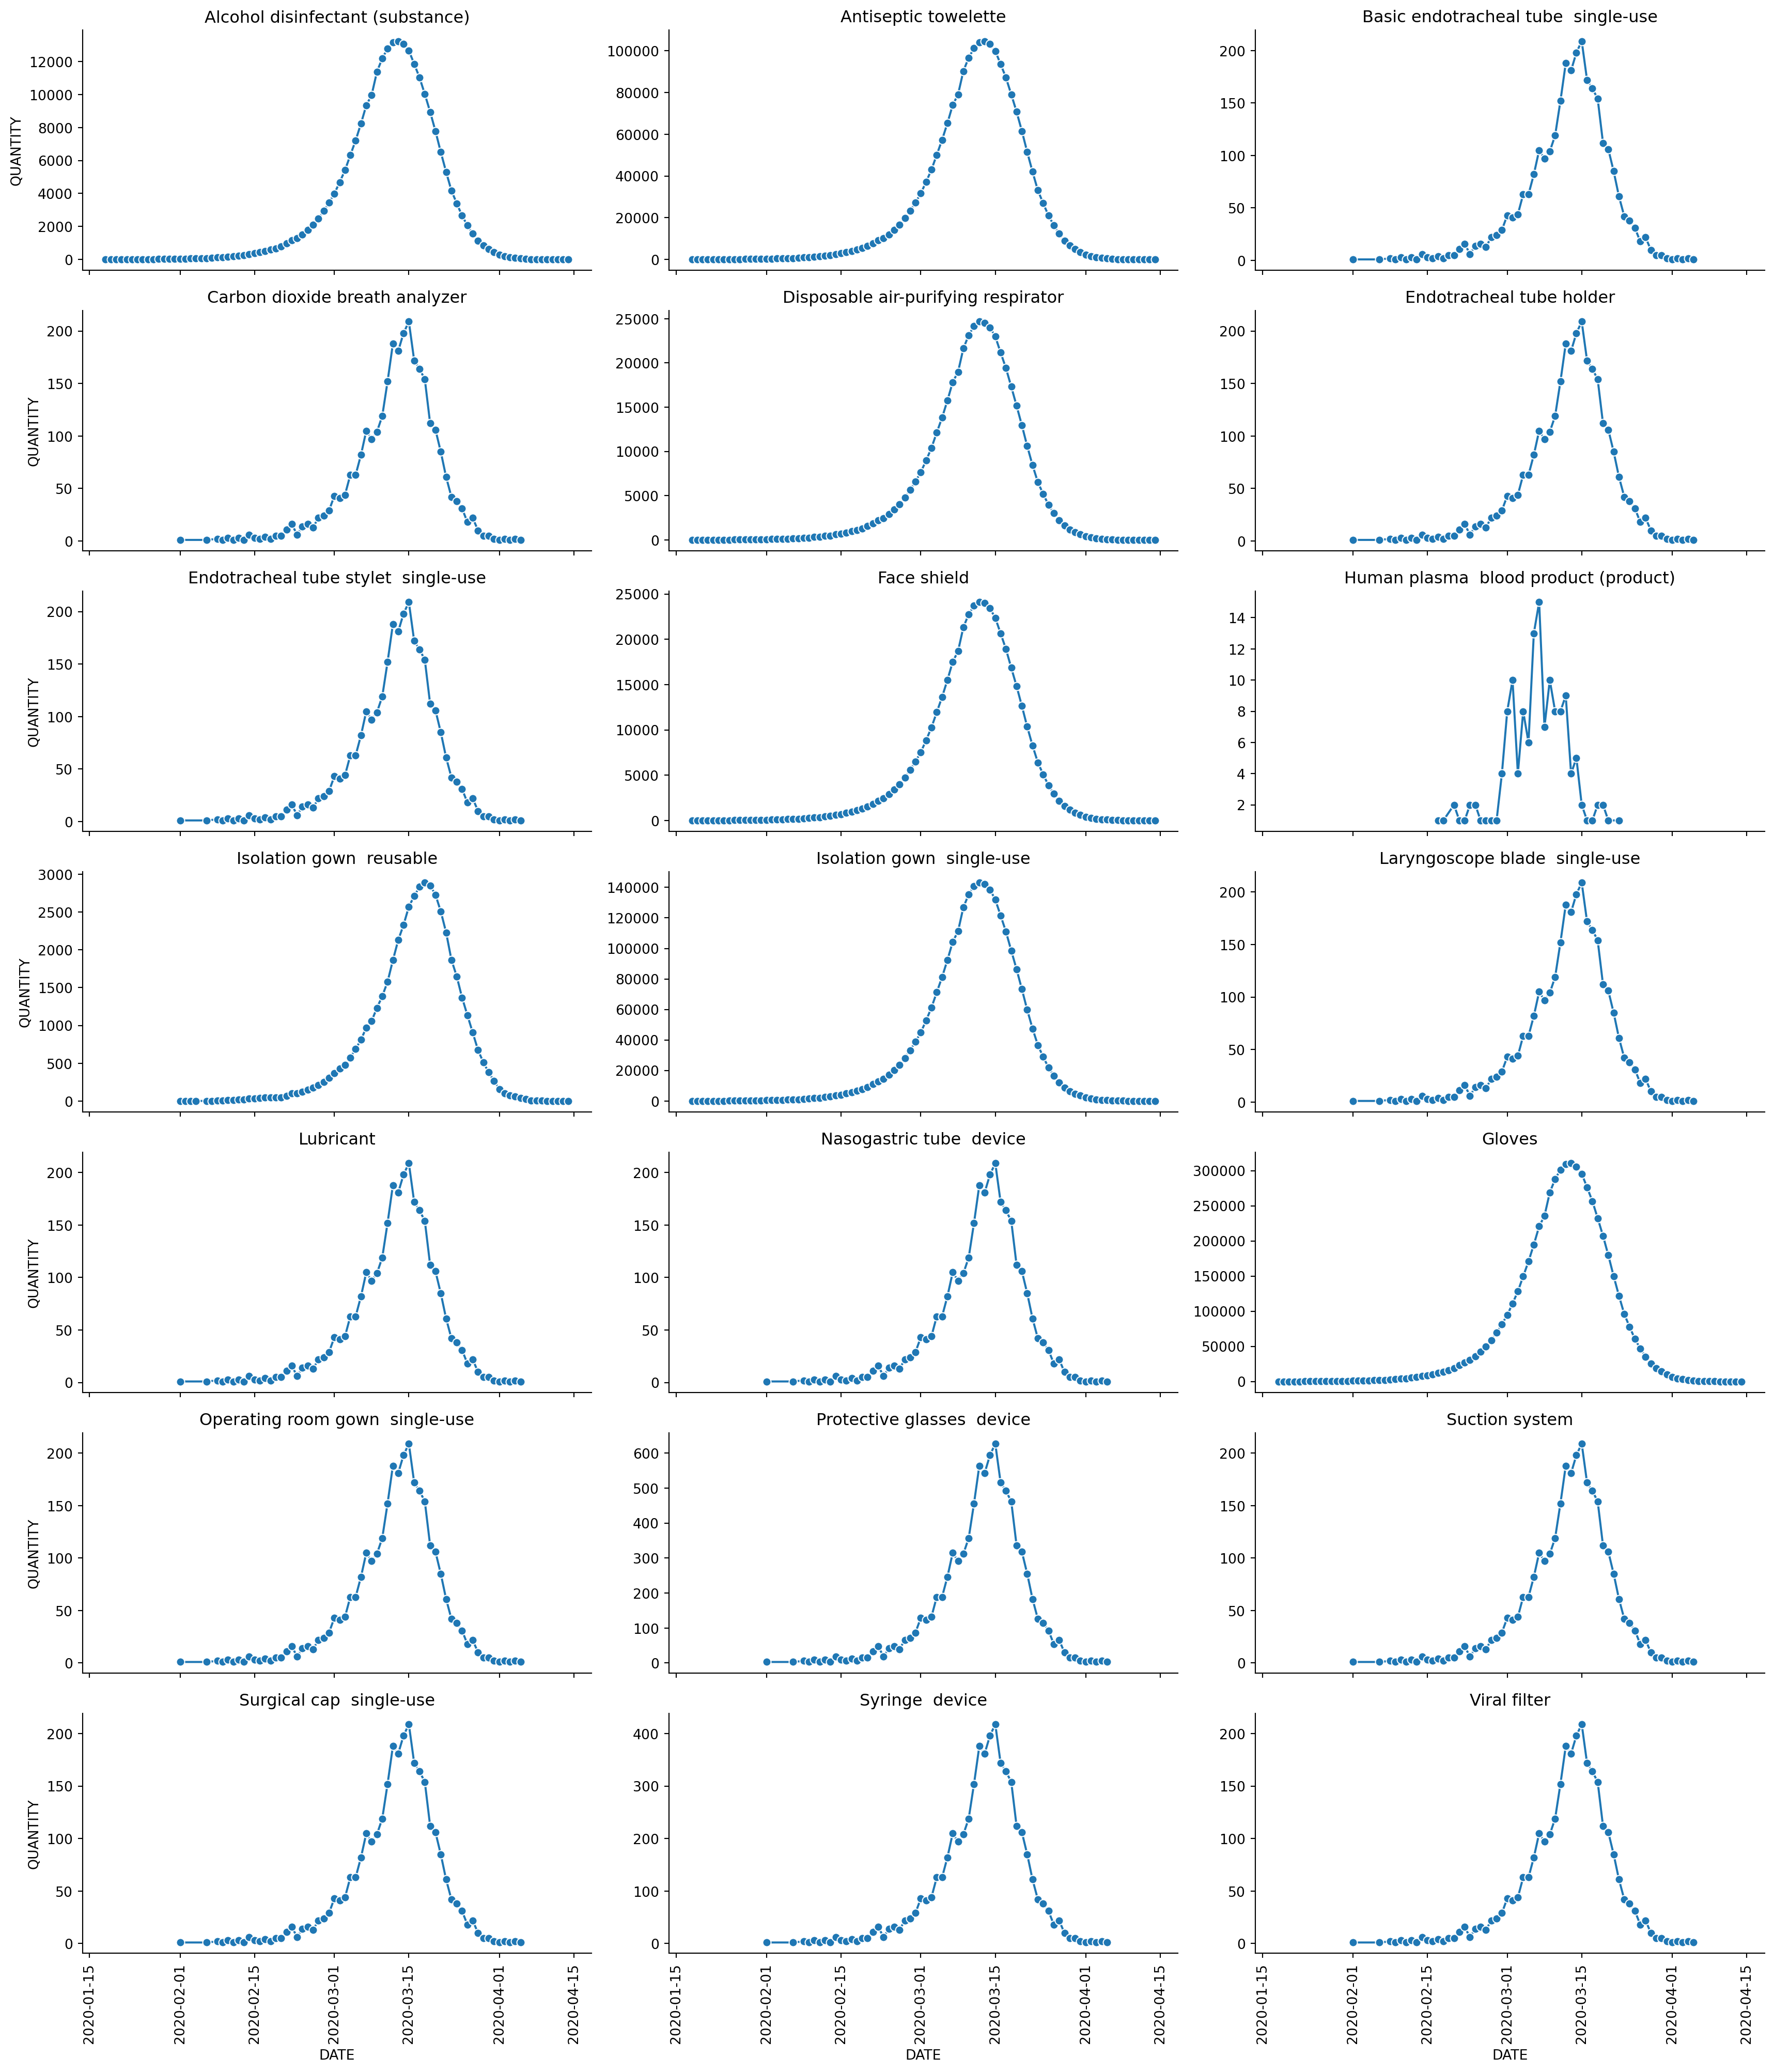
9.0.13 Cumulative Case Count
A table showing total supplies used over the entire simulation
Build a DataFrame that has cumulative case counts over time
case_counts = conditions[conditions.CODE == 840539006].groupby('START').count()[['PATIENT']]
case_counts['total'] = case_counts['PATIENT'].cumsum()
case_counts = case_counts.rename(columns={'PATIENT': 'daily'})
case_counts = case_counts.reset_index()
case_counts['START'] = pd.to_datetime(case_counts.START)
axes = sns.lineplot(x='START', y='total', data=case_counts)
plt.xticks(rotation=90)
plt.show()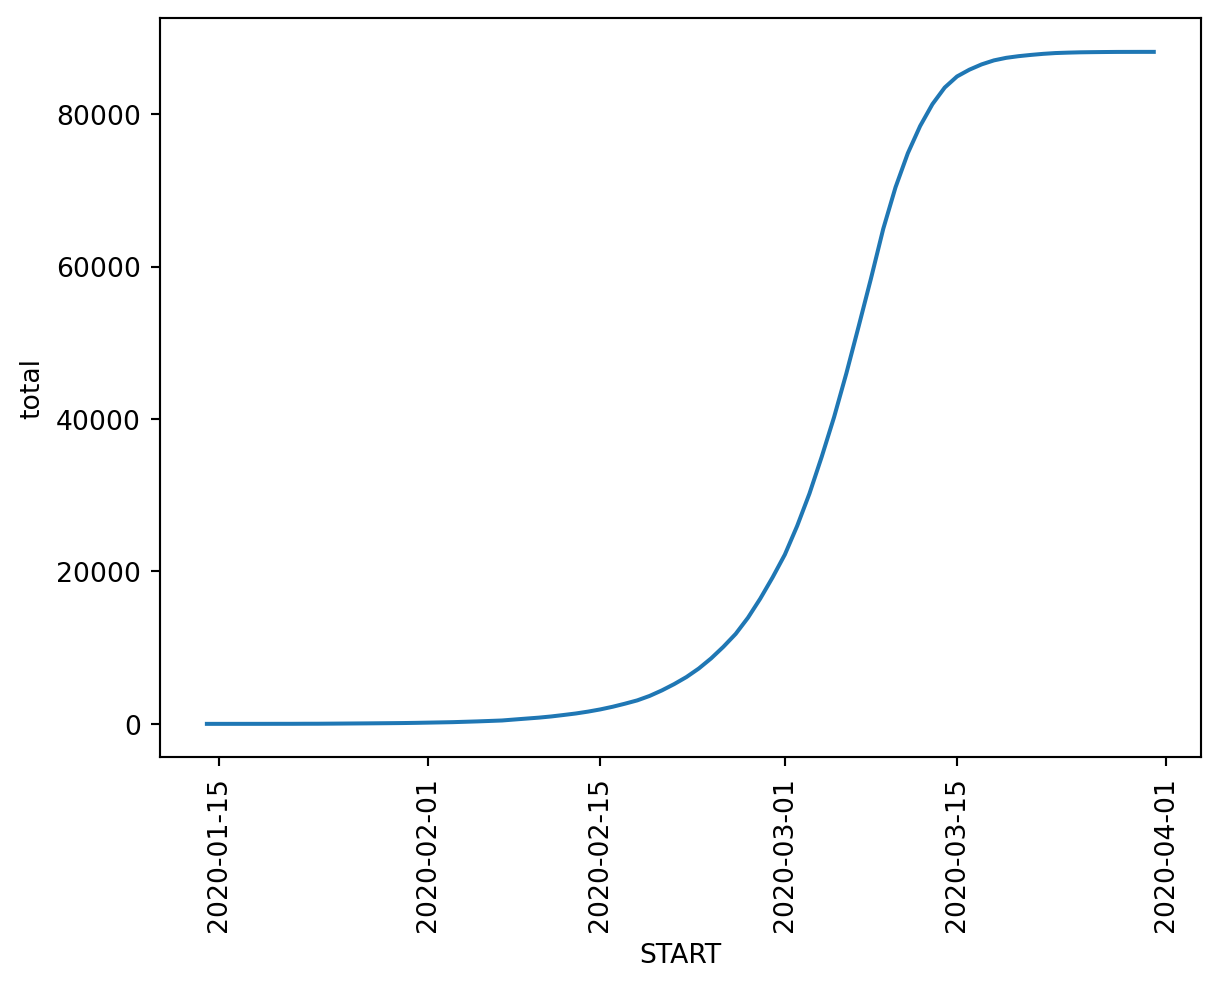
9.0.14 Hospital Day Stats
For patients with COVID-19, calculate the average hospital length of stay as well as total hospital days for all COVID-19 patients. Provide the same information for ICU patients
covid_hosp = covid_info[covid_info['admit'] == True].merge(encounters, on='PATIENT')
covid_hosp = covid_hosp[covid_hosp['REASONCODE'] == 840539006]
covid_hosp['START'] = pd.to_datetime(covid_hosp.START)
covid_hosp['STOP'] = pd.to_datetime(covid_hosp.STOP)
covid_hosp['days'] = (covid_hosp.STOP - covid_hosp.START) / np.timedelta64(1, 'D')
covid_hosp = covid_hosp[['PATIENT', 'icu_admit', 'START', 'STOP', 'days']]
covid_hosp = covid_hosp.rename(columns={'START': 'hospital_start', 'STOP': 'hospital_stop'})
covid_hosp = covid_hosp.drop_duplicates(subset=['PATIENT', 'hospital_start', 'hospital_stop'])
covid_hosp = covid_hosp.sort_values(by='hospital_start')
covid_hosp = covid_hosp.reset_index(drop=True)
covid_hosp.head(3)| PATIENT | icu_admit | hospital_start | hospital_stop | days | |
|---|---|---|---|---|---|
| 0 | 641699c3-03c0-40fc-9f14-38247e0a8cfa | False | 2020-01-18 20:55:04+00:00 | 2020-02-02 05:14:04+00:00 | 14.346528 |
| 1 | d19da9db-c5a7-468f-aadf-3c7cd5b5a8d2 | False | 2020-01-20 12:24:28+00:00 | 2020-02-08 22:59:28+00:00 | 19.440972 |
| 2 | a654fdb6-0796-4fb5-9ad8-435e38ed5168 | False | 2020-01-22 23:57:08+00:00 | 2020-01-25 00:27:08+00:00 | 2.020833 |
# Group by hospital admission and ICU admission
grouped_data = covid_hosp.groupby(['icu_admit']).agg(
    mean_days=('days', 'mean'),
    total_days=('days', 'sum'),
    patient_count=('PATIENT', 'nunique')
).reset_index()

# Rename the columns for better readability
grouped_data = grouped_data.rename(columns={
    'icu_admit': 'Admission'
})
grouped_data['Admission'] = grouped_data['Admission'].map({False: 'Non-ICU Inpatients', True: 'ICU Admission'})

# Calculate the total row
total_row = {
    'Admission': 'Total',
    'mean_days': grouped_data['mean_days'].mean(),
    'total_days': grouped_data['total_days'].sum(),
    'patient_count': grouped_data['patient_count'].sum()
}

# Append the total row to the DataFrame using pd.concat
grouped_total = pd.concat(
    [grouped_data, pd.DataFrame([total_row])],
    ignore_index=True
)

# Display the updated DataFrame
grouped_total| Admission | mean_days | total_days | patient_count | |
|---|---|---|---|---|
| 0 | Non-ICU Inpatients | 13.817881 | 214412.061111 | 14498 |
| 1 | ICU Admission | 5.376755 | 59305.611806 | 3677 |
| 2 | Total | 9.597318 | 273717.672917 | 18175 |
9.0.15 Device Usage
Show the number of devices used to treat COVID-19 over time.
device_codes = [448907002, 449071006, 36965003]
grouped_dev = devices[devices.CODE.isin(device_codes)].groupby(['DESCRIPTION', 'START']).count()
grouped_dev = grouped_dev.reset_index()
grouped_dev['START'] = pd.to_datetime(grouped_dev.START)
import seaborn as sns
import matplotlib.pyplot as plt
import pandas as pd
# Prepare data
gd = grouped_dev.reset_index()
gd['START'] = pd.to_datetime(gd['START'], errors='coerce') # Ensure dates are valid
# Create FacetGrid
g = sns.FacetGrid(
data=gd,
col="DESCRIPTION",
col_wrap=3,
sharey=False,
height=3,
aspect=2
)
g.map_dataframe(sns.lineplot, x="START", y="PATIENT", marker="o") # Use marker="o" instead of "."
# Clean up axes titles and rotate tick labels
for ax in g.axes.flat:
title = ax.get_title()
cleaned_title = title.replace("DESCRIPTION = ", "").replace(" (physical object)", "").strip()
ax.set_title(cleaned_title)
for tick in ax.get_xticklabels():
tick.set_rotation(90)
plt.tight_layout()
plt.show()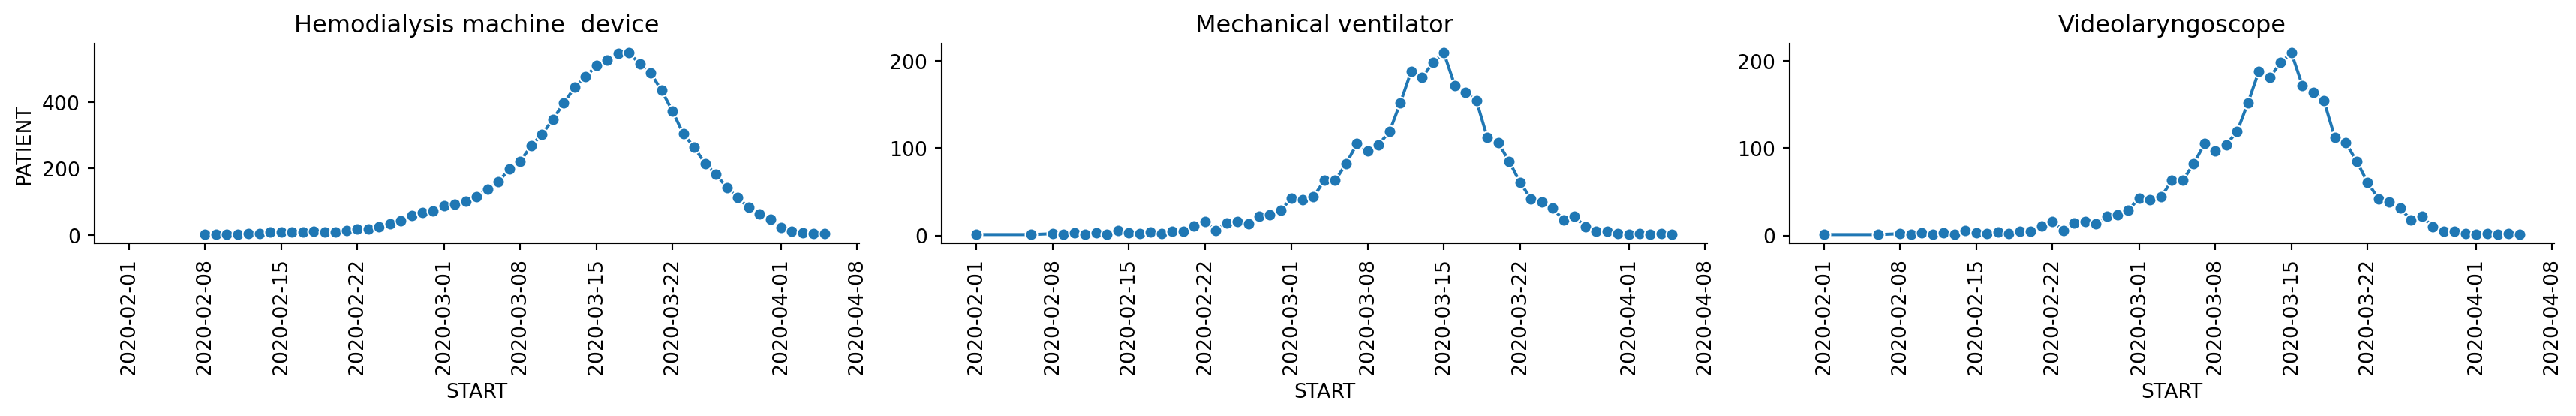
9.0.16 Medication Dispenses
This table shows medications dispensed to patients with COVID-19 since January 20, 2020.
covid_meds = medications[pd.to_datetime(medications.START) > pd.to_datetime('2020-01-20')]
covid_meds = covid_info.merge(covid_meds, on='PATIENT')
# Use only numeric columns for aggregation
covid_meds.groupby(['DESCRIPTION'])[['DISPENSES']].sum().sort_values('DISPENSES', ascending=False).head(10)| DISPENSES | |
|---|---|
| DESCRIPTION | |
| Acetaminophen 500 MG Oral Tablet | 35509 |
| 0.4 ML Enoxaparin sodium 100 MG/ML Prefilled Syringe | 34733 |
| 1 ML Enoxaparin sodium 150 MG/ML Prefilled Syringe | 20332 |
| NDA020503 200 ACTUAT Albuterol 0.09 MG/ACTUAT Metered Dose Inhaler | 17163 |
| Hydrochlorothiazide 25 MG Oral Tablet | 6832 |
| Simvastatin 10 MG Oral Tablet | 5779 |
| insulin human isophane 70 UNT/ML / Regular Insulin Human 30 UNT/ML Injectable Suspension [Humulin] | 5392 |
| 1 ML Epoetin Alfa 4000 UNT/ML Injection [Epogen] | 4817 |
| amLODIPine 5 MG / Hydrochlorothiazide 12.5 MG / Olmesartan medoxomil 20 MG Oral Tablet | 4799 |
| Atenolol 50 MG / Chlorthalidone 25 MG Oral Tablet | 4550 |
9.0.17 Conclusion
In this project, I explored the Synthea COVID-19 dataset to analyze various health outcomes and symptoms experienced by COVID-19 patients. I focused on inpatients, ICU-admitted patients, and ventilated individuals, examining their conditions, treatments, and outcomes.
I learned how to:
extract data for specific analyses, such as filtering, merging, and recoding data based on fields like ‘CODE’, ‘REASONCODE’, and ‘DESCRIPTION’, for different groups of patients including inpatients, COVID patients, ICU-admitted, and ventilated individuals.